The Bollinger Bands + RSI Indicator combines two independent analytical tools into a single confirmation-based system. Each tool evaluates a different aspect of price behavior — Bollinger Bands reflect price position relative to a statistical range, while RSI measures momentum on a normalized scale. The indicator registers a condition only when both components align simultaneously, which reduces the frequency of low-context readings compared to using either tool independently.
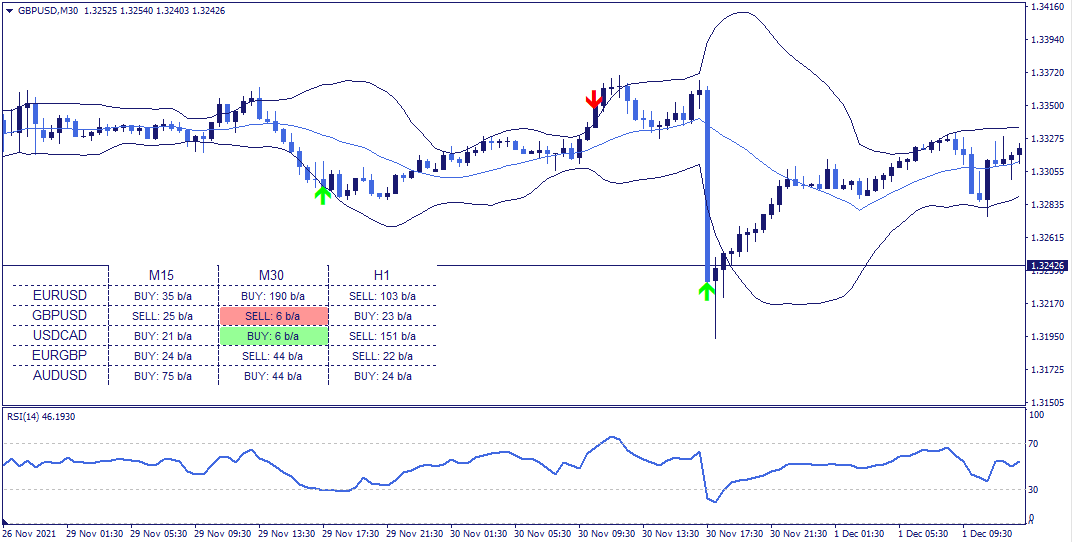
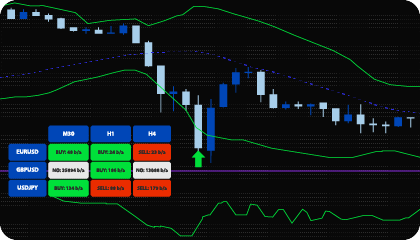
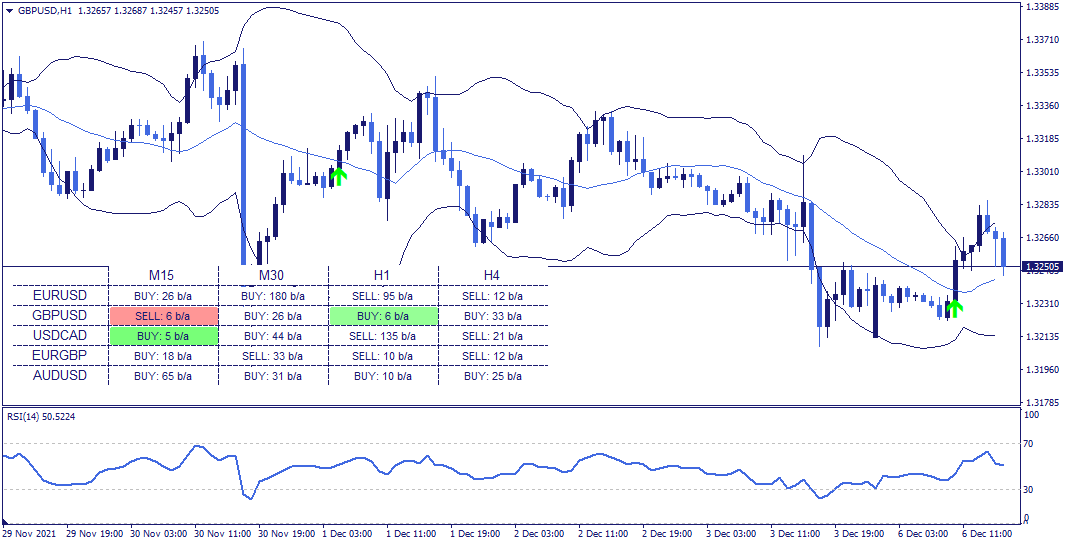
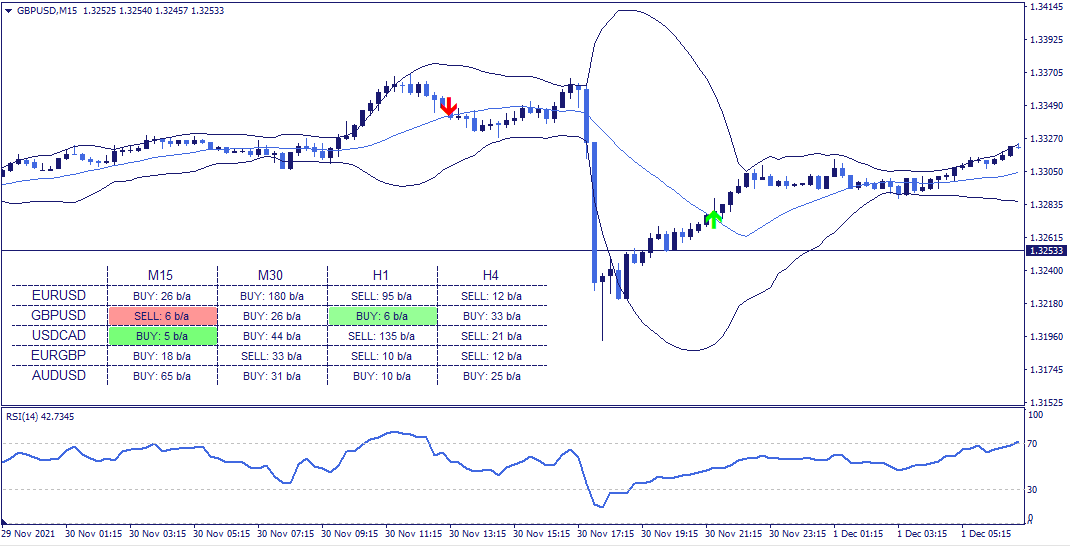
Bollinger Bands consist of three lines: a central moving average and two outer bands positioned at a standard deviation distance above and below it. The bands dynamically expand and contract with volatility. Price typically moves within the band boundaries — when it reaches or exceeds the outer bands, it has moved to a statistically extended position relative to recent price behavior.
RSI (Relative Strength Index) oscillates between 0 and 100, measuring the speed and magnitude of recent price changes. Readings above 70 reflect overbought conditions — price has risen sharply relative to recent history. Readings below 30 reflect oversold conditions — price has fallen sharply. These zones are used as reference points for evaluating potential momentum exhaustion.
When both conditions occur together — price at or beyond a Bollinger Band boundary while RSI is in the corresponding extreme zone — the combined reading carries more structural weight than either indicator alone.
The indicator offers two detection modes, selectable in the settings.
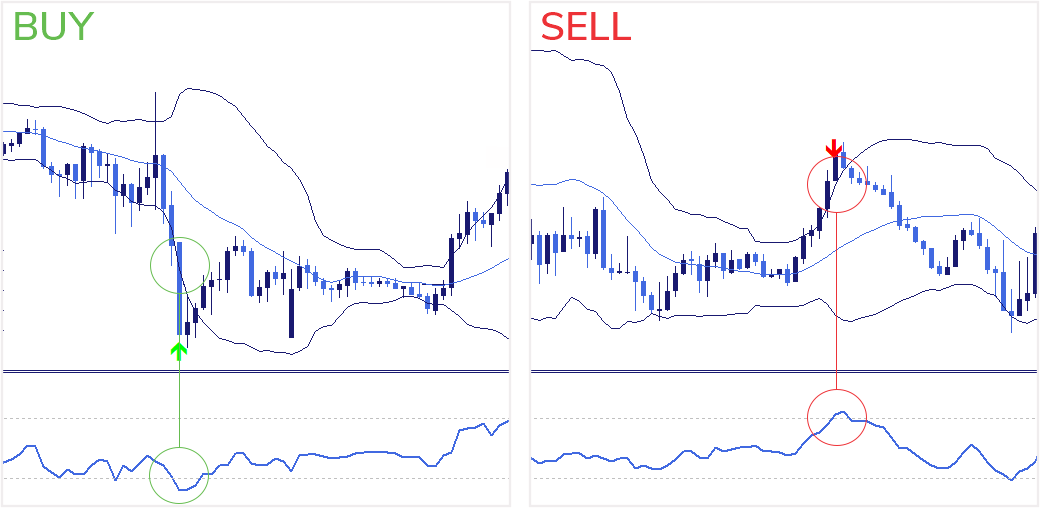
Aggressive mode — a condition is registered when price moves beyond the upper or lower Bollinger Band boundary while RSI is simultaneously in the overbought (above 70) or oversold (below 30) zone. This mode registers conditions at the earliest point of alignment between the two components.
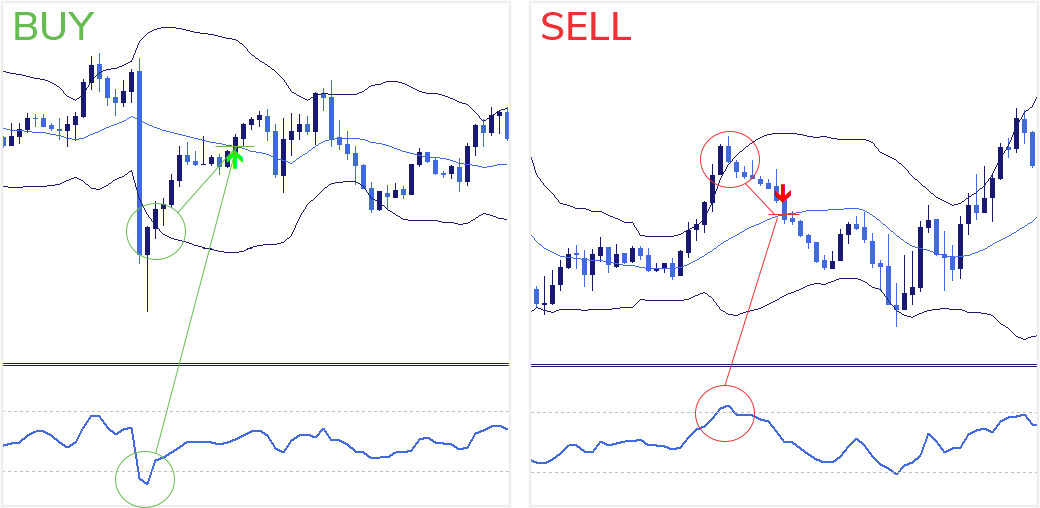
Conservative mode — a condition is registered when price crosses back through the central Bollinger Band line (the moving average), having previously extended beyond the outer band while RSI was in an extreme zone. This mode waits for price to begin returning toward the statistical center before registering the condition, requiring an additional confirmation step relative to Aggressive mode.
The choice between modes affects how early the condition is registered and how many conditions are registered overall — Aggressive mode produces more frequent readings, Conservative mode produces fewer but with an additional structural filter applied.
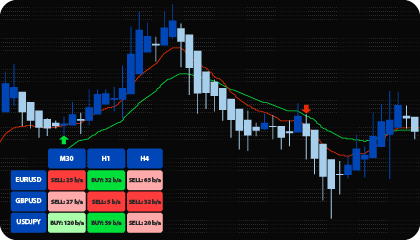
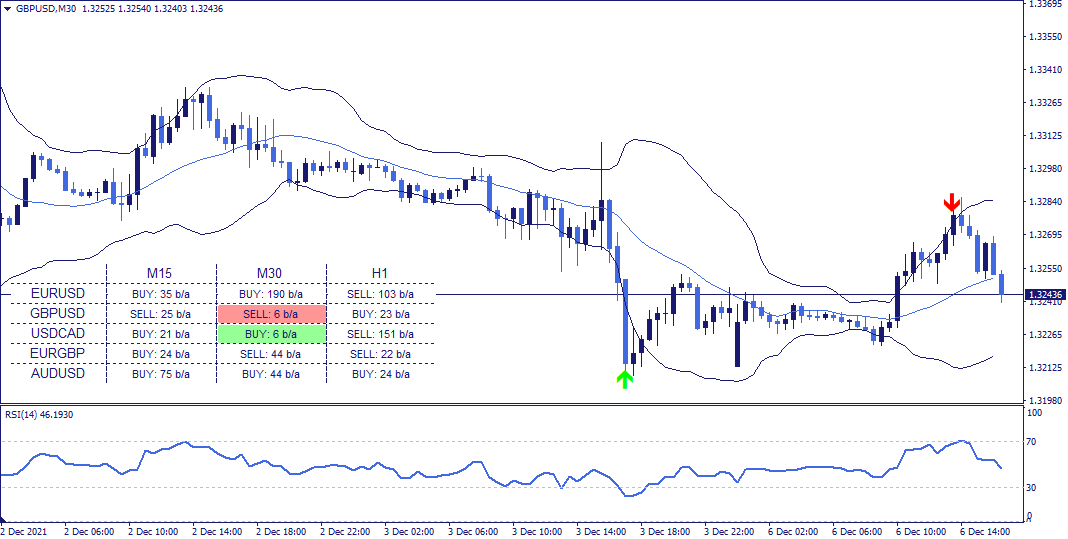
The dashboard displays the current detection status across all monitored assets and timeframes in a single structured view.
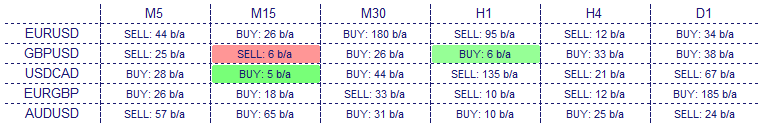
Each cell shows the directional context of the most recently registered condition — bullish or bearish — and the number of bars back at which it was registered. Green cells indicate a bullish condition, red cells a bearish one. Color saturation decreases as the condition becomes less recent, making it straightforward to identify the most current readings.
Clicking any cell updates the chart to the corresponding asset and timeframe directly.
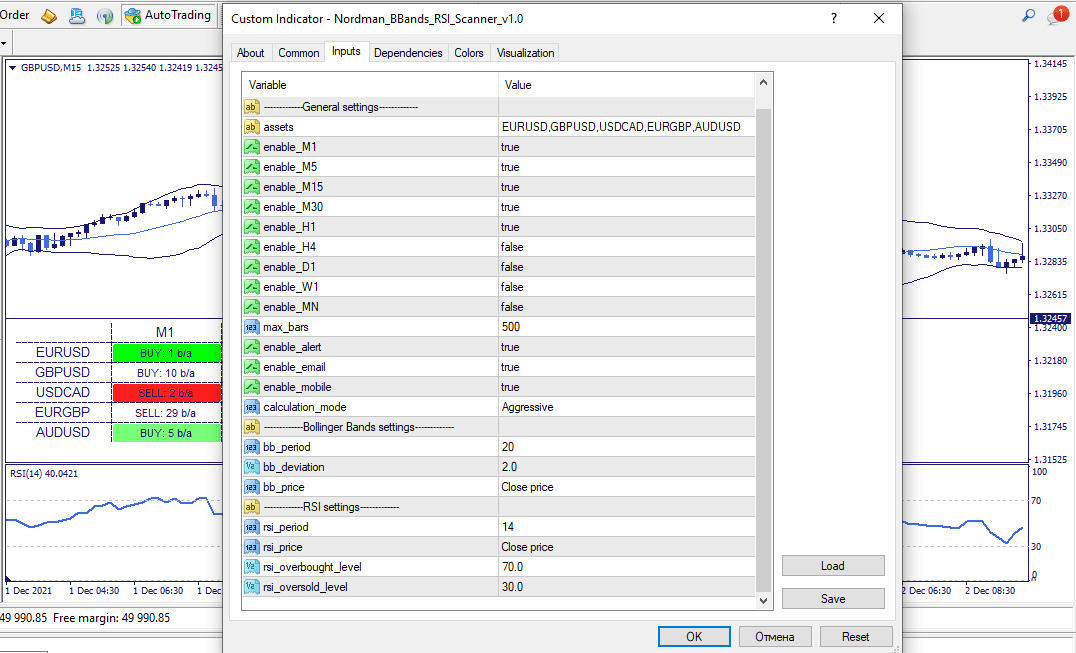
The indicator has the following parameters:
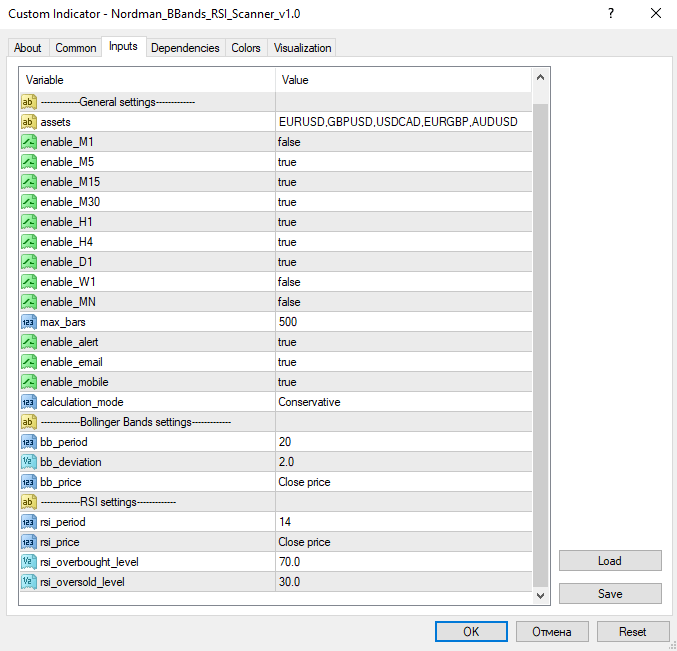
Assets — instruments to include in the scanner.
Enable_M1–MN — include or exclude individual timeframes from the scanner scope.
Max_bars — limits how far back the scanner evaluates conditions. Reducing this value improves calculation speed.
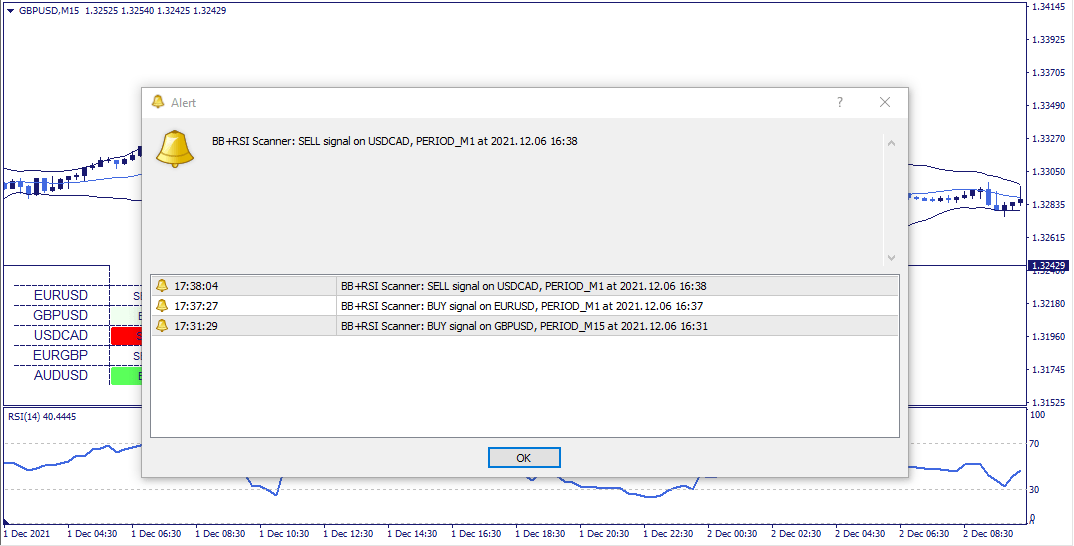
Enable alert / Enable email / Enable mobile — alert delivery configuration: platform notifications, email, or mobile — each configurable independently.
Calculation_mode — selects the detection mode: Aggressive or Conservative.
Bollinger Bands and RSI settings — configure target levels, periods, and calculation methods for each component independently.
Indicator Limitations
The Bollinger Bands + RSI Indicator reflects calculations based on historical price data. Registered conditions indicate that both components have reached defined threshold values simultaneously — they do not predict future price movement or guarantee any particular market outcome. The statistical basis of Bollinger Bands means that price can remain at or beyond the band boundaries for extended periods. All registered conditions should be evaluated within a broader analytical framework.

We can customize this indicator to your requirements by adding new features, modifying calculation logic, or combining multiple tools into a unified solution.
We also develop automated trading strategies (Expert Advisors) based on custom logic. The system can include configurable management modules such as dynamic risk parameters, multi-stage trailing stops, additional confirmation filters, and other custom functionality based on your specifications.
The final solution is delivered with full source code and post-delivery support. Contact us for a free consultation to discuss the scope and timeline of your project.
We are committed to the ongoing development and refinement of our indicators. If you’ve spotted a bug, feel that something essential is missing, or have ideas that could make the indicator even better, just send us a message. Your feedback helps us improve and deliver tools that truly meet traders’ needs.
Nordman Algorithms is a trade name of Nordman Algorithms OÜ (Reg. No. 14435535), registered in Tallinn, Estonia.
Software Nature & User Responsibility — Nordman Algorithms provides algorithmic software tools for technical analysis. Nordman Algorithms is not a financial advisor and is not liable for any losses. All trades conducted based on the software’s output are executed at the user’s sole discretion and risk.
Visual Markers & Signal Disclosure — This software may display visual markers (such as arrows, dots, or alerts) when predefined mathematical conditions are met. These markers are provided for educational and analytical purposes only, must not be interpreted as financial guidance, and do not constitute a recommendation to buy, sell, or hold any financial instrument. Users must independently validate all visual cues within their own trading methodology.
No Financial Advice — Nordman Algorithms does not provide discretionary trading signals, investment advice, or managed signal services. Our software represents a mathematical visualization of historical and real-time data. The appearance of a visual marker does not guarantee a profitable trade or predict future market behavior.
Trading Risk Warning — Futures, Forex, and options trading involve significant risk. Risk capital is money that can be lost without jeopardizing financial security. Only risk capital should be used for trading. Past performance is not indicative of future results. View Full Risk Disclosure: https://www.nordman-algorithms.com/risk-disclosure/
ESMA Risk Warning — Financial instruments, especially those involving leverage such as CFDs and Forex, are complex and carry a high risk of rapid financial loss. Our software provides analytical outputs and visual markers based on predefined mathematical conditions and does not mitigate or reduce inherent market risks. You should carefully consider whether you understand how leveraged financial instruments work and whether you can afford the high risk of losing your capital.
CFTC Rule 4.41 — Hypothetical or simulated performance results have inherent limitations. Unlike actual performance records, simulated results do not represent real trading. Because trades have not actually been executed, these results may under- or over-compensate for the impact of market factors such as liquidity. No representation is being made that any account will achieve profits or losses similar to those shown.