Order Block Concept Explained
An Order Block (OB) refers to a price area where significant buying or selling activity is thought to have taken place before a strong directional move. These zones are widely used in ICT (Inner Circle Trader) and Smart Money Concepts (SMC) methodologies as reference areas when price later returns to the same zone.
Bullish Order Blocks form before upward displacement — they represent areas where price moved lower briefly before reversing sharply higher, leaving a zone that may later act as a demand reference. Bearish Order Blocks form before downward displacement in the same way, marking areas that may later act as supply references.
Not every Order Block produces a meaningful interaction when price returns. Context matters — the broader structure, the age of the zone, how many times it has already been visited, and how price behaves when it gets there all contribute to how relevant a given block is at any moment.
This indicator automates Order Block detection, tracks each zone through its full lifecycle, and visualizes active, mitigated, and expired blocks directly on the chart.
cTrader Order Block Indicator — Key Features
Order Block Detection & Filtering
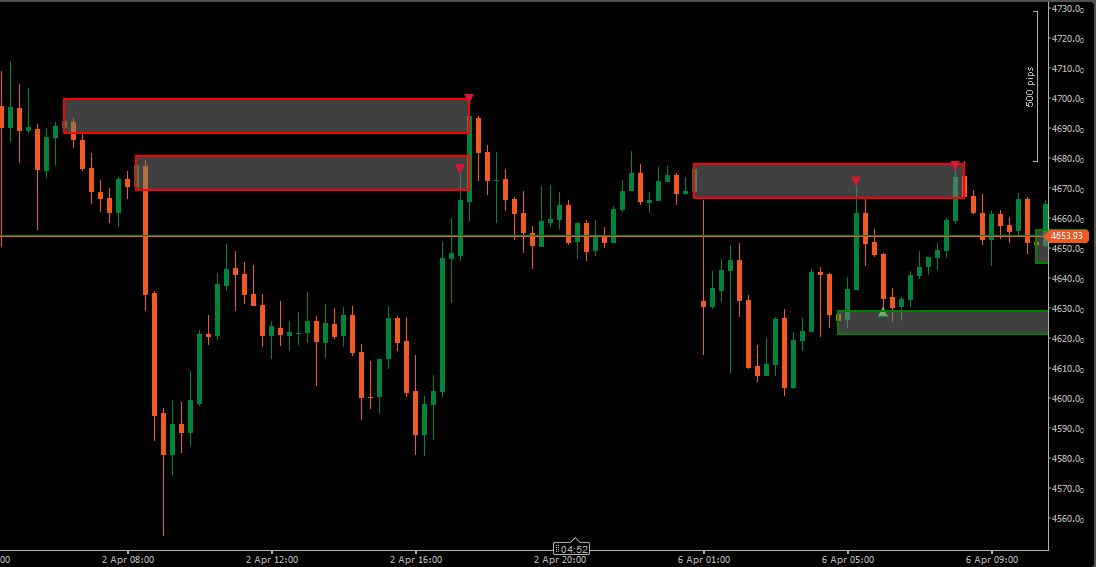
The indicator automatically detects Bullish and Bearish Order Blocks and displays them as structured zones directly on the chart.
A minimum gap size filter can be defined in ticks, points, or percentage — helping focus on blocks formed by meaningful displacement rather than minor price fluctuations.
OB Min Length (bars) defines how many bars must pass before a newly created zone becomes visible. If price returns into the block before this minimum is reached, the zone is not displayed. This filters out blocks that are immediately revisited before they can remain on the chart as stable reference zones.
|
Minimum Gap Size: 10 Ticks
|
Minimum Gap Size: 30 Ticks
|
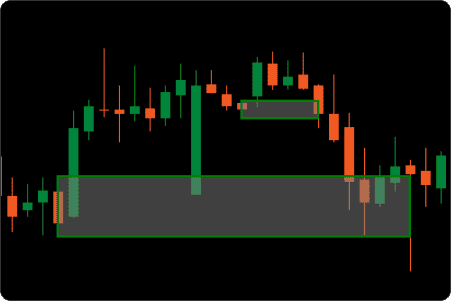
OB Range Type — Three Zone Boundary Models
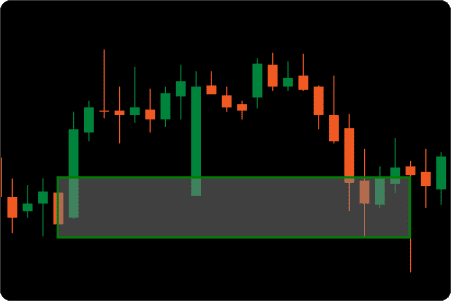
The zone boundary of an Order Block can be defined in three different ways, each representing a different interpretation of where the block actually begins and ends.
High / Low uses the full candle range — from the highest point to the lowest. This is the widest interpretation and captures the entire price action of the order block candle, including wicks.
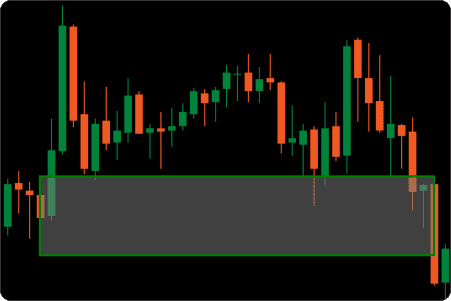
Open / Close uses only the candle body — from open to close. This is a tighter interpretation that focuses on where price committed rather than where it briefly extended. Some traders prefer this when they want the zone to represent a more precise area of interest.
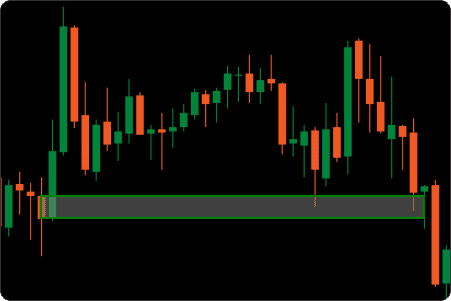
Open / High / Low uses the open price combined with the relevant extreme — the low for bullish blocks, the high for bearish blocks. This is a hybrid approach that keeps the zone anchored to the candle open while including the directional extreme of the move.
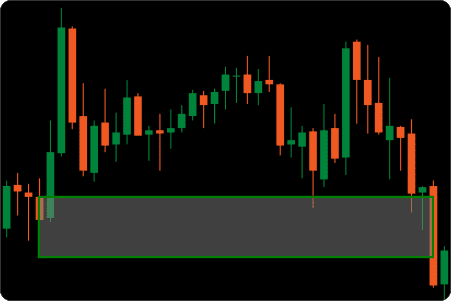
The choice between these models affects how the zone appears on the chart and when mitigation is triggered — a wider zone is harder to fully mitigate, while a tighter body-only zone may be reached sooner.
|
High / Low
|
Open / Close
|
Open / High / Low
|
Zone Lifecycle & State Management
Each Order Block moves through a defined sequence of states after formation.
A new block begins as Active. If price later satisfies the selected mitigation condition, the zone transitions to Mitigated. If the block remains untouched beyond the configured lifetime, it becomes Expired — and can remain visible on the chart in a separate visual state for historical reference.
Zone lifetime can be measured in bars or minutes, allowing the logic to adapt to different chart speeds and trading styles. A display limit can also be set to control how many zones remain on the chart at once.
Mitigation Logic
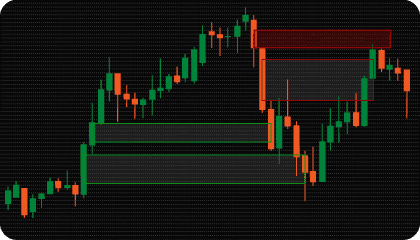
Two mitigation models are available, each representing a different threshold for when a block is considered filled.
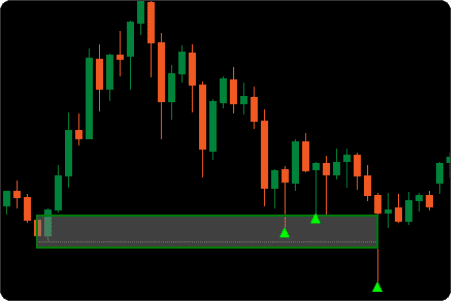
Full Mitigation requires price to move completely through the zone boundary before the block changes state. For bullish blocks, this means price must trade below the lower boundary. For bearish blocks, price must trade above the upper boundary. This is the strictest interpretation.
Partial Mitigation triggers as soon as price enters the zone. The first qualifying interaction is enough to mark the block as mitigated.
Mitigation can be confirmed using High/Low prices or Close prices. Close mode is stricter — requiring a candle to close beyond the boundary rather than simply touching it. High/Low mode reacts faster.
|
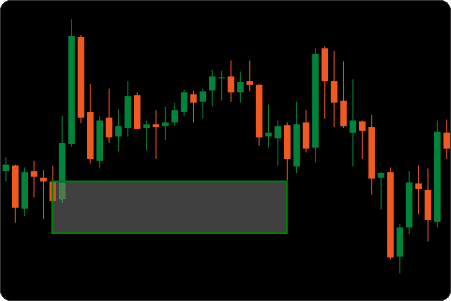
Partial Mitigation
|
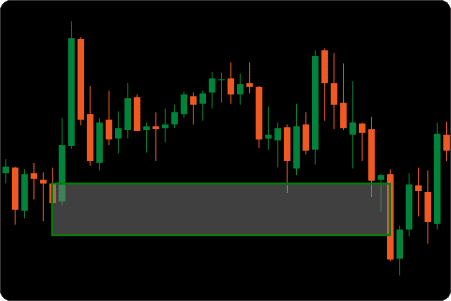
Full Mitigation
|
Threshold Level — Visual Reference & Mitigation Trigger
The threshold is a configurable percentage level drawn inside each Order Block zone. It divides the zone at a defined depth — for example, 50% threshold sits at the midpoint of the block.
The threshold can serve two distinct purposes depending on how it is configured.
As a visual reference only, the threshold line appears inside the zone without affecting when the block is considered mitigated. This is useful when monitoring how deeply price moves into the zone — without changing the mitigation state of the block itself.
As a mitigation trigger (when “Mitigation at Threshold” is enabled), the block is considered mitigated once price reaches the threshold level — not the full zone boundary. This allows treating partial zone penetration as sufficient interaction, while keeping the threshold visible as the exact level where the state change occurred.
A separate threshold alert can also be enabled to notify when price reaches this level.
|
Threshold 50%
|
Threshold 80%
|
Alerts, Signals & Retouch Logic
The indicator provides alerts for three key events: Order Block created, zone touched, and zone mitigated. Notifications can be configured as popup, sound, or email.
Touch signals support retouch logic — if price enters an active zone, exits it, and later re-enters from outside, a new touch signal can be generated. This allows tracking repeated interaction with the same block rather than treating the first touch as the only event.
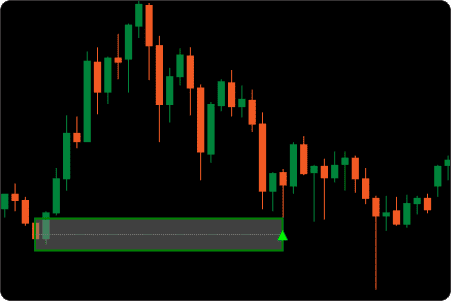
Optional markers can be displayed when mitigation occurs, making it easy to identify which bars triggered a state change.
Run it quietly, or use it as an active Order Block monitoring tool.
How to Interpret and Use the cTrader Order Block Indicator
Reading Active Order Blocks
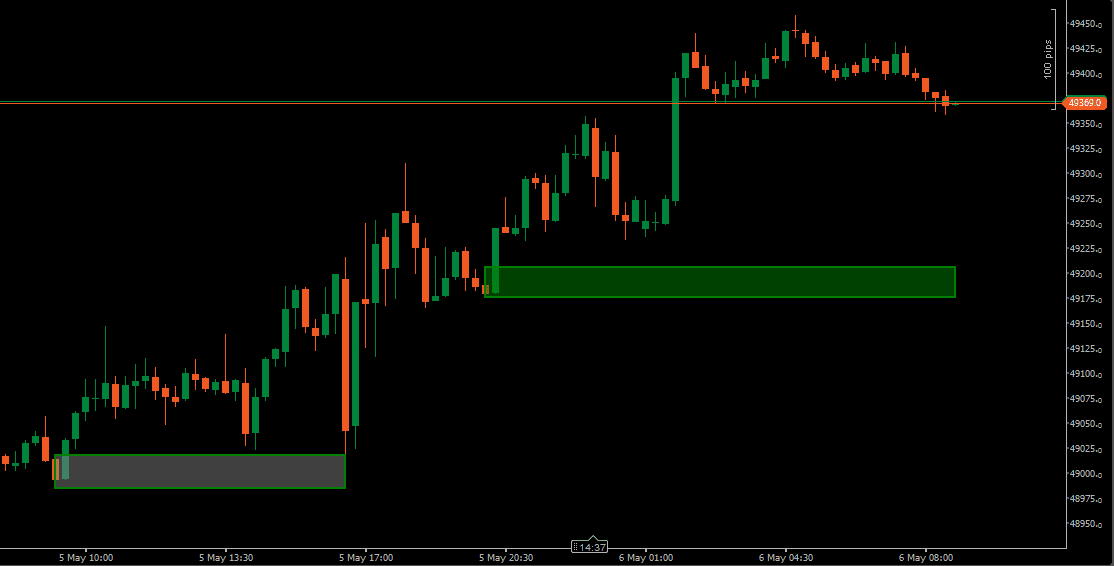
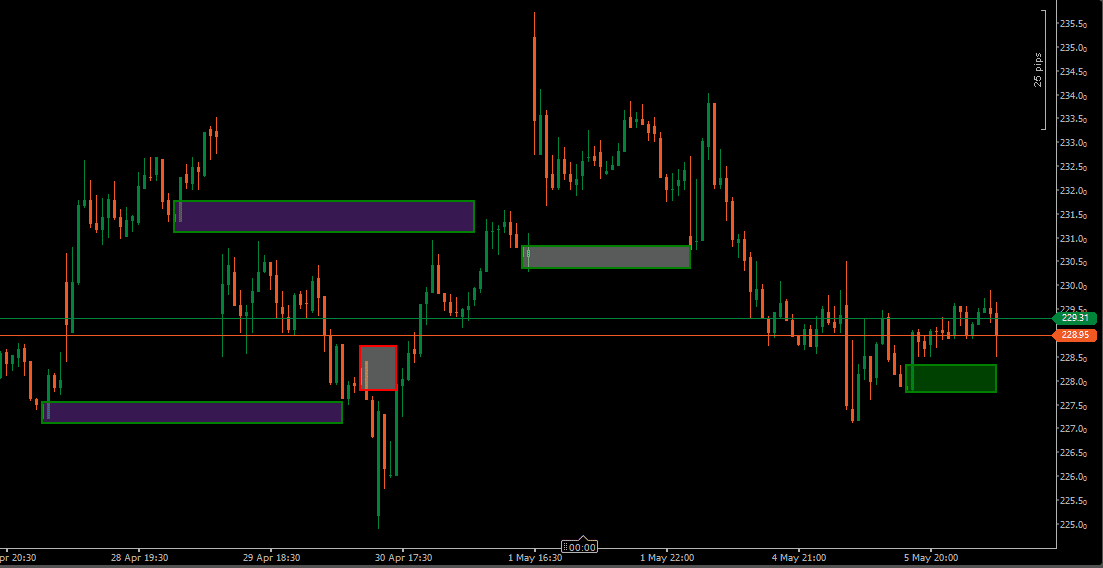
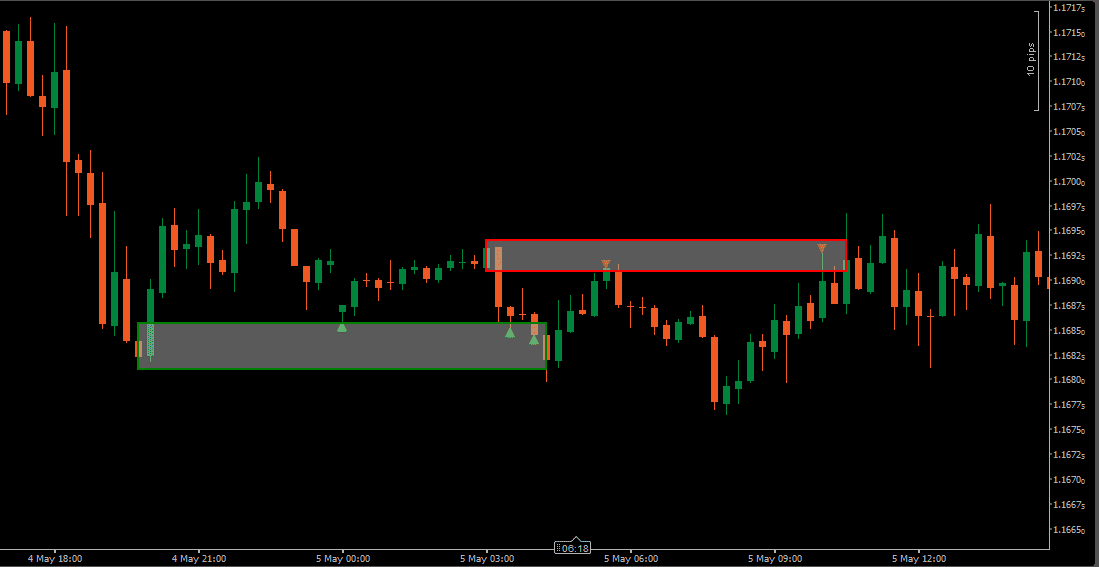
Active zones represent Order Blocks that have not yet been mitigated or expired. These are the areas where price has not yet returned after the initial displacement — making them the first areas many traders review.
Bullish blocks are typically monitored when price trades above the zone and later begins to retrace downward toward it. Bearish blocks are watched when price moves below the zone and later rallies back up into it.
The key observation with any active block is not just whether price returns — but how it behaves when it gets there, and how that interaction compares to the selected mitigation criteria.
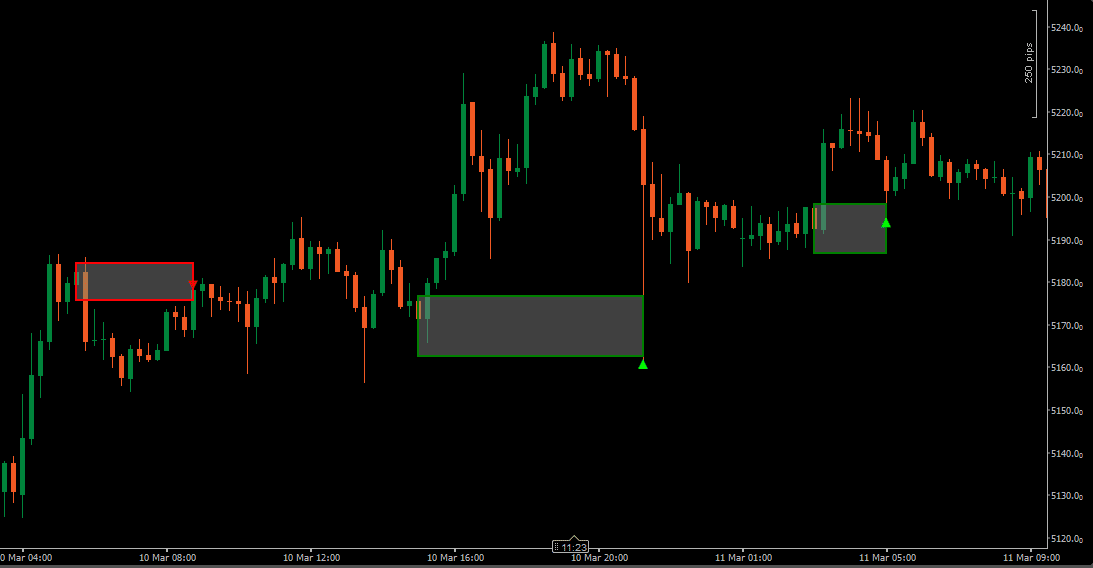
Understanding Mitigated and Expired Zones
When price satisfies the selected mitigation condition, the zone transitions to Mitigated status and remains visible in a separate color. This helps separate zones that have already been interacted with from those that remain untested.
If price never returns within the configured lifetime, the zone becomes Expired. Keeping expired zones on the chart provides historical context — showing which blocks were never visited and how old structural areas relate to current price levels.
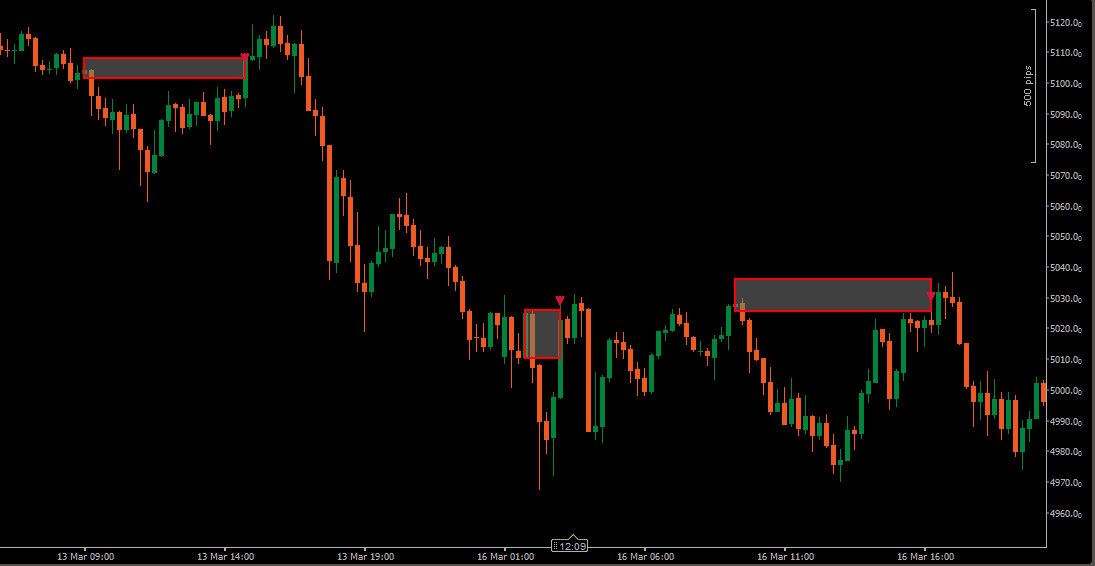
Working with Touch and Retouch Behavior
A touch event occurs when price enters an active Order Block zone. Unlike indicators that treat the first touch as the only signal event, this indicator can generate a new signal each time price re-enters the zone from outside after previously exiting it.
This retouch logic is relevant when the same block is visited multiple times — each return represents renewed interaction with an area that has not yet been fully mitigated.
Using the Threshold as a Zone Reference
The threshold line divides an Order Block at a configurable depth. Whether used purely as a visual guide or as a mitigation trigger, it provides a concrete reference point inside the zone rather than treating the entire block as a uniform area.
When monitoring how price interacts with a zone, the threshold can indicate whether price has made shallow contact or has penetrated more deeply — which some traders use to evaluate the significance of the interaction before making further observations.
Indicator Settings & Parameters
Alerts
- Enable Pop Up Alert — Displays an on-screen popup when a selected Order Block event occurs.
- Enable Sound Alert — Plays a sound notification when an alert is triggered.
- Alert Sound File — Selects the sound file used for audio alerts.
- Enable Email Alert — Sends an email notification when supported alert events occur. Requires email settings to be configured in cTrader.
- Email To — Defines the destination email address for notifications.
Order Block Settings
Show OB Type
Controls which zone states are displayed on the chart.
- All — shows every zone regardless of state
- Active — shows only unmitigated, non-expired zones
- Unactive All — shows mitigated and expired zones
- Unactive Mitigated — shows only mitigated zones
- Unactive Expired — shows only expired zones
OB Range Type
Defines how the zone boundaries are calculated from the Order Block candle.
- High / Low — full candle range including wicks
- Open / Close — candle body only, from open to close
- Open / High / Low — open price combined with the relevant directional extreme
Mitigation Method
Defines when a zone is considered mitigated.
- Fully — price must move completely through the zone boundary
- Partially — first entry into the zone triggers mitigation
- Mitigation Price Type — Specifies which price is used to confirm mitigation: High/Low or Close. Close mode is stricter — requiring a candle close beyond the boundary rather than a wick touch.
- Gap Size Mode / Minimum Gap Size — Selects how minimum displacement is measured (Ticks, Points, or Percentage) and sets the minimum value. Blocks formed by moves smaller than this threshold are not displayed.
- OB Min Length (bars) — Defines how many bars must pass before a newly created zone becomes visible. If price returns into the block before this minimum is reached, the zone is filtered out.
- Max OB Duration / OB Duration Type / OB Duration Value — Controls expiration logic. When enabled, zones that remain unmitigated beyond the set duration (in bars or minutes) transition to Expired status.
- Enable OBs Display Limit / Max Number of OBs to Display — Limits how many zones are visible at the same time. Useful on busy charts or when focusing on the most recently formed blocks.
OB Threshold Settings
- Enable Threshold — When enabled, a dotted line is drawn inside each Order Block zone at the configured percentage depth. This line is visible on the chart regardless of whether it is used as a mitigation trigger or purely as a reference level.
- Threshold Value (%) — Sets the depth of the threshold line as a percentage of the zone height. A value of 50 places the line at the midpoint of the block. Lower values place it closer to the zone entry, higher values place it deeper.
- Mitigation at Threshold — When enabled, the zone is considered mitigated once price reaches the threshold level — not the full zone boundary. The threshold line marks the exact level where the state change occurred. When disabled, the threshold is displayed as a visual reference only and does not affect mitigation logic.
- Enable Threshold Alert — Triggers a notification when price reaches the threshold level inside an active zone.
OB Alerts
- OB Creation — Triggers when a new Order Block zone is detected and passes all active filters.
- OB Touched — Triggers when price enters an active zone. Supports retouch logic — can fire again if price re-enters the zone from outside after previously exiting.
- OB Mitigated — Triggers when a zone satisfies the selected mitigation condition.
OB Signals
- OB Touched Signal — Displays a directional signal marker on the chart when price enters an active zone. Supports retouch — a new signal can appear each time price re-enters the zone from outside.
OB Visual Settings
- Bullish OB Color / Opacity — Controls the appearance of active bullish zones.
- Bearish OB Color / Opacity — Controls the appearance of active bearish zones.
- Mitigated OB Color / Opacity — Controls how mitigated zones appear. A distinct color keeps historical context visible without competing with active zones.
- Expired OB Color / Opacity — Controls how expired zones appear when preserved on the chart.
Custom Programming
Need changes to this indicator? We can customize it to your specifications — adding new functions, modifying logic, refining visuals, or integrating it with other cTrader tools.
We also convert indicators into cBots with advanced features such as trailing stops, position parameter controls, execution filters, and rule-based automation built to your technical specifications.
Request a free consultation to discuss the technical scope, timeline, and available development options.
We Value Your Feedback
We are committed to the ongoing development and refinement of our indicators. If you’ve spotted a bug, feel that something essential is missing, or have ideas that could make the indicator even better, just send us a message. Your feedback helps us improve and deliver tools that truly meet traders’ needs.
FAQ
1. What is an Order Block in trading?
An Order Block is a price area associated with significant buying or selling activity before a strong directional move. The concept is widely used in ICT and Smart Money Concepts (SMC) methodologies as a reference area when price later returns to the same zone.
2. Does the cTrader Order Block Indicator repaint?
No. Once an Order Block is detected and plotted, its location is fixed based on completed candle data. The zone does not move retroactively.
Zone status may later update to mitigated or expired as price develops, but the original zone boundaries remain unchanged.
3. How is this cTrader Order Block Indicator different from other OB tools?
Many Order Block tools draw zones and stop there. This indicator manages the full lifecycle of each block and includes features not common in standard implementations.
Key differences include:
- Three zone boundary models — High/Low, Open/Close, and Open/High/Low
- Threshold level with dual-mode functionality — visual reference or mitigation trigger
- Active / Mitigated / Expired state tracking with independent visual controls
- OB Min Length filter — blocks immediately revisited never reach the chart
- Retouch-based signal logic — repeated zone entries can each generate a signal
- Full and Partial mitigation with High/Low or Close confirmation
4. What is the difference between the three OB Range Types?
Each range type defines the zone differently based on the Order Block candle.
- High / Low — uses the full candle range including wicks. This is the widest interpretation.
- Open / Close — uses only the candle body. This is a tighter zone focused on where price committed.
- Open / High / Low — uses the open price combined with the relevant directional extreme. A hybrid approach between the two above.
The choice affects zone width, when mitigation triggers, and how frequently price interacts with the zone.
5. What does the Threshold do and what is the difference between the two modes?
The threshold is a percentage-based line drawn inside the Order Block zone at a configurable depth.
In visual reference mode (Mitigation at Threshold disabled), the line appears on the chart but does not affect when the zone is considered mitigated. It can be used to observe how deeply price penetrates the zone before reacting.
In mitigation trigger mode (Mitigation at Threshold enabled), the zone is considered mitigated once price reaches the threshold level — not the full zone boundary. The line marks the exact level where the state change occurred. A separate threshold alert can also be enabled.
6. What is the difference between Full and Partial mitigation?
- Full — price must move completely through the zone boundary before mitigation is confirmed
- Partial — first entry into the zone triggers mitigation
Full mitigation is stricter and keeps zones active longer. Partial mitigation reacts to the first interaction with the zone.
7. Can the indicator generate signals on the same zone more than once?
Yes. If price enters an active zone, exits it, and later re-enters from outside, a new touch signal can be generated. This retouch logic allows tracking repeated interaction with the same block rather than treating the first touch as the only event.
8. Can mitigated or expired zones remain visible on the chart?
Yes. Both mitigated and expired zones can remain on the chart using distinct colors and opacity settings. This allows reviewing how price interacted with previous Order Block areas while keeping active zones visually separate.
9. Can the indicator send alerts?
Yes. Available alerts include Order Block creation, zone touch (with retouch support), mitigation, and threshold level interaction. Notifications can be delivered as popup messages, sound alerts, or email. Each alert type can be enabled independently.
10. Which markets and timeframes can this indicator be used on?
The indicator works on any instrument available in cTrader, including Forex pairs, Gold, Indices, and CFDs.
Order Block analysis applies to any timeframe. Higher timeframes typically produce larger structural zones, while lower timeframes show more granular blocks relevant to shorter-term analysis. The preferred timeframe depends on trading style and how the blocks are being used within broader market context.
Disclaimer — Software Use & Risk Disclosure
Nordman Algorithms is a trade name of Nordman Algorithms OÜ (Reg. No. 14435535), registered in Tallinn, Estonia.
Software Nature & User Responsibility — Nordman Algorithms provides algorithmic software tools for technical analysis. Nordman Algorithms is not a financial advisor and is not liable for any losses. All trades conducted based on the software’s output are executed at the user’s sole discretion and risk.
Visual Markers & Signal Disclosure — This software may display visual markers (such as arrows, dots, or alerts) when predefined mathematical conditions are met. These markers are provided for educational and analytical purposes only, must not be interpreted as financial guidance, and do not constitute a recommendation to buy, sell, or hold any financial instrument. Users must independently validate all visual cues within their own trading methodology.
No Financial Advice — Nordman Algorithms does not provide discretionary trading signals, investment advice, or managed signal services. Our software represents a mathematical visualization of historical and real-time data. The appearance of a visual marker does not guarantee a profitable trade or predict future market behavior.
Trading Risk Warning — Forex, CFDs, futures, options, and other leveraged financial instruments involve significant risk. Risk capital is money that can be lost without jeopardizing financial security. Only risk capital should be used for trading. Past performance is not indicative of future results. View Full Risk Disclosure: https://www.nordman-algorithms.com/risk-disclosure/
ESMA Risk Warning — Financial instruments, especially those involving leverage such as CFDs and Forex, are complex and carry a high risk of rapid financial loss. Our software provides analytical outputs and visual markers based on predefined mathematical conditions and does not mitigate or reduce inherent market risks. You should carefully consider whether you understand how leveraged financial instruments work and whether you can afford the high risk of losing your capital.
CFTC Rule 4.41 — Hypothetical or simulated performance results have inherent limitations. Unlike actual performance records, simulated results do not represent real trading. Because trades have not actually been executed, these results may under- or over-compensate for the impact of market factors such as liquidity. No representation is being made that any account will achieve profits or losses similar to those shown.