Kill Zones are fixed time windows used in ICT (Inner Circle Trader) and Smart Money Concepts (SMC) methodologies to separate high-activity trading periods from quieter hours. Rather than treating all chart time equally, Kill Zones help focus attention on sessions where traders often monitor directional movement, liquidity sweeps, or range expansion.
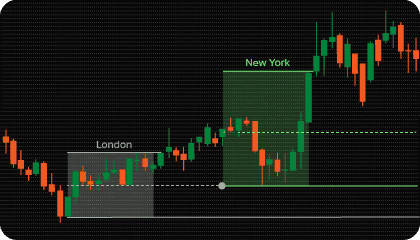
The most commonly watched windows are the London open and the New York open — periods where session transitions often bring increased participation and volatility. The Asia session is frequently used as a reference range, with traders monitoring whether London or New York expands beyond or respects those earlier boundaries.
Session highs and lows are not just visual markers. They become reference levels that price may return to later in the day — sometimes acting as support/resistance reference areas, sometimes breaking and continuing. The midpoint of a session range adds another internal reference that can be useful when evaluating price acceptance within the zone.
This indicator automates the entire framework: marking session windows on the chart, projecting pivot levels from completed zones, and maintaining custom time-based reference prices throughout the trading day.
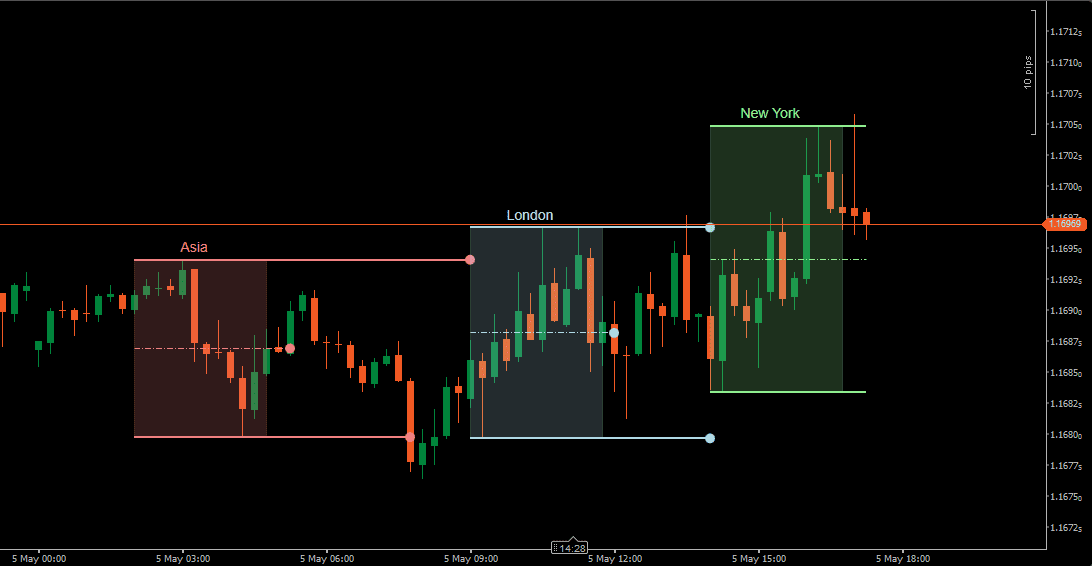
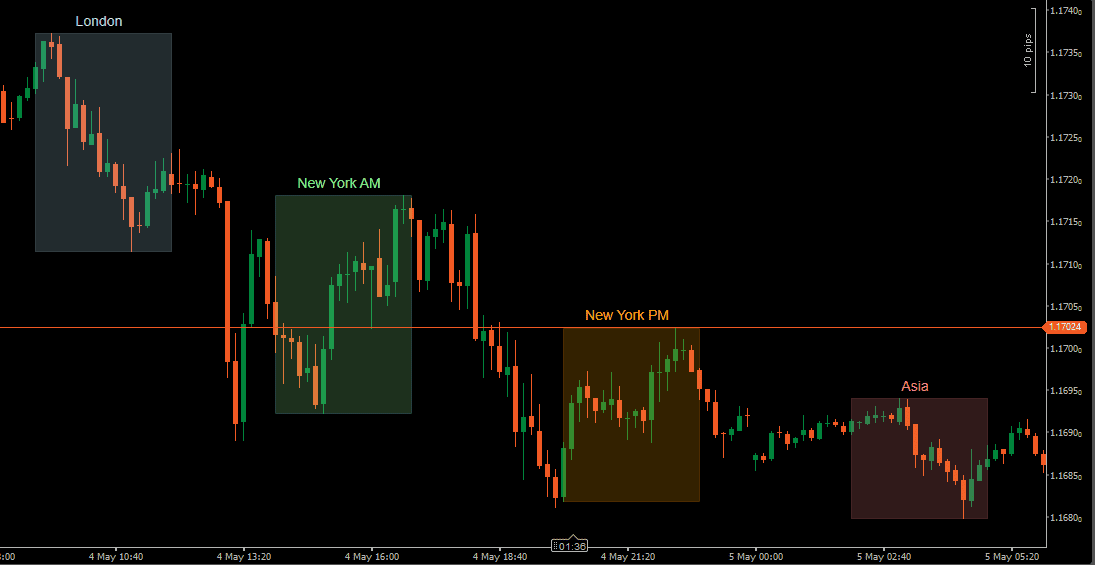
The indicator supports four independent session zones: Asia, London, New York, and a fully Custom Session. Each zone is drawn directly on the chart using configurable start and end times in EST, allowing the layout to match different broker feeds, instruments, or personal session preferences.
Every session can be enabled or disabled individually, renamed, and styled with its own color and opacity. This means the chart can show all four zones at once, or only the sessions that matter to a given workflow — without changing the setup of the other sessions.
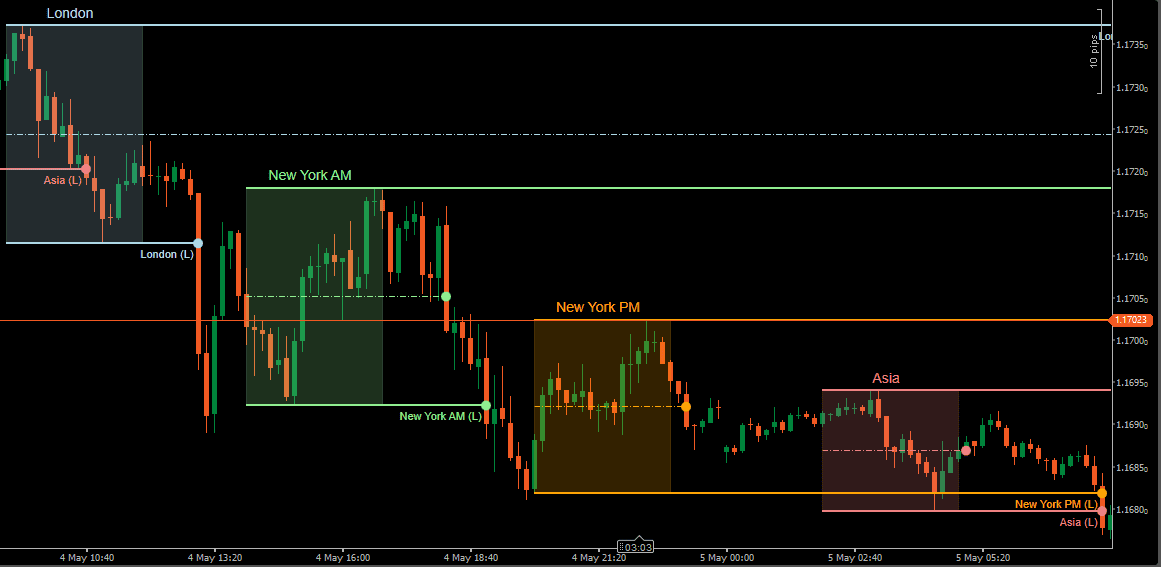
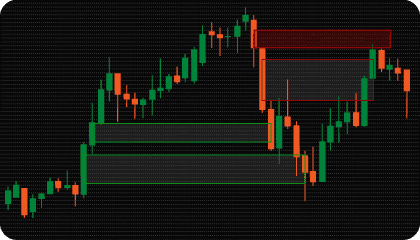
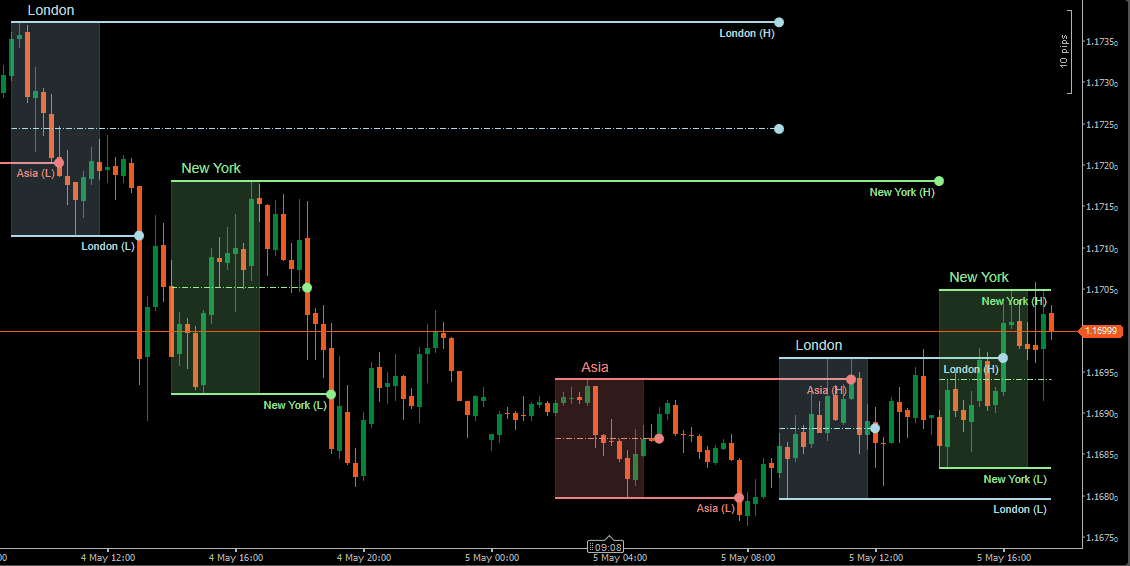
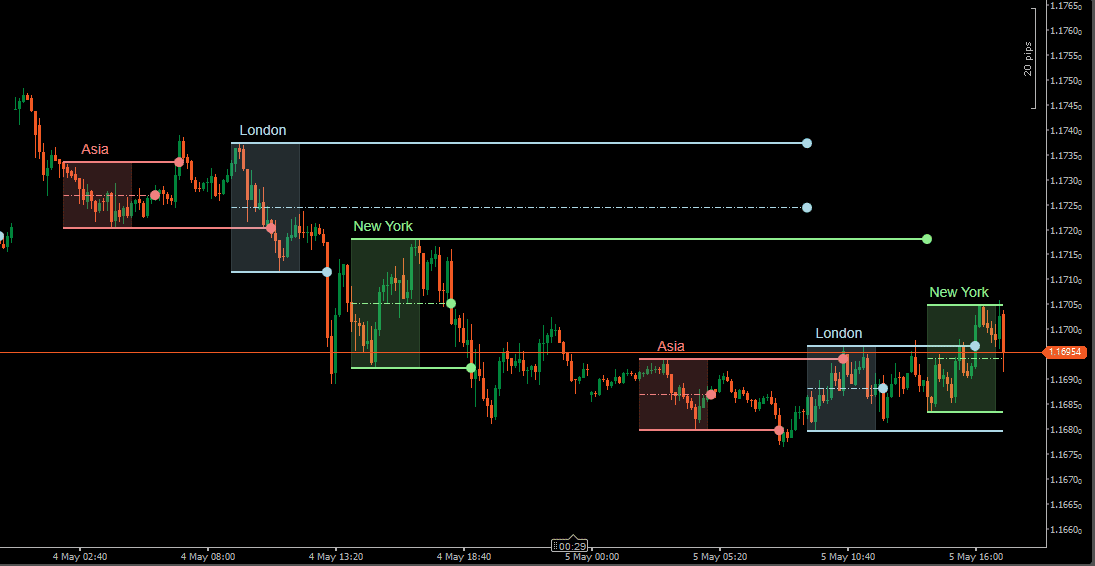
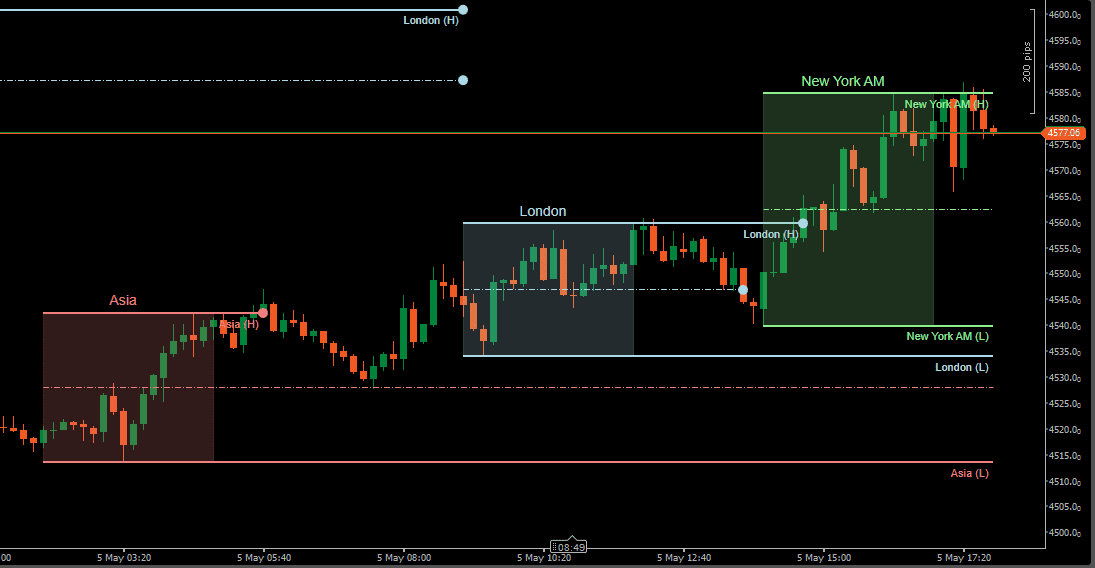
Once a session closes, the indicator can project three horizontal reference levels from the completed zone: High Pivot, Low Pivot, and optional Middle Pivot. These levels mark the boundaries and midpoint of the session range and remain available as price reference points during subsequent activity.
A pivot is considered broken only when a candle closes beyond it — not just touches it. This close-based breakout logic prevents wicks from prematurely ending pivot lines, keeping levels active until price genuinely commits beyond the boundary.
When Pivot Extension is enabled, unbroken pivot levels continue forward until the next session of the same type begins. For example, London pivots remain active until the next London session opens — unless price closes through them first. This keeps relevant reference levels on the chart without requiring manual management.
Session breakout alerts and middle pivot cross alerts can be enabled independently to notify when these key levels are reached.
Beyond standard session highs and lows, the indicator includes up to 10 independent Custom Pivots. Each one captures the open price at a defined start time and projects that level as a horizontal line until the configured end time.
This is useful for building a personalized set of intraday reference prices that go beyond what session zones cover. Common applications include:
Each custom pivot has its own label, color, line style (solid, dashed, dotted), and width settings, making it easy to distinguish levels visually on a busy chart.
The indicator includes alerts for two structural events: session boundary breakouts (when price closes beyond a High or Low pivot) and middle pivot crosses (when price crosses the session midpoint).
Notifications can be delivered as popup messages, sound alerts, or email — and each alert type can be enabled or disabled independently.
Run it quietly as a visual reference tool, or use it as an active session-monitoring system.
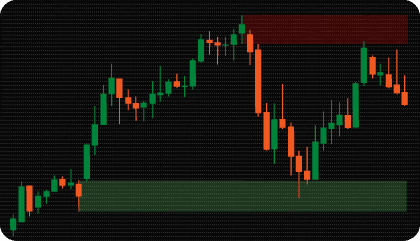
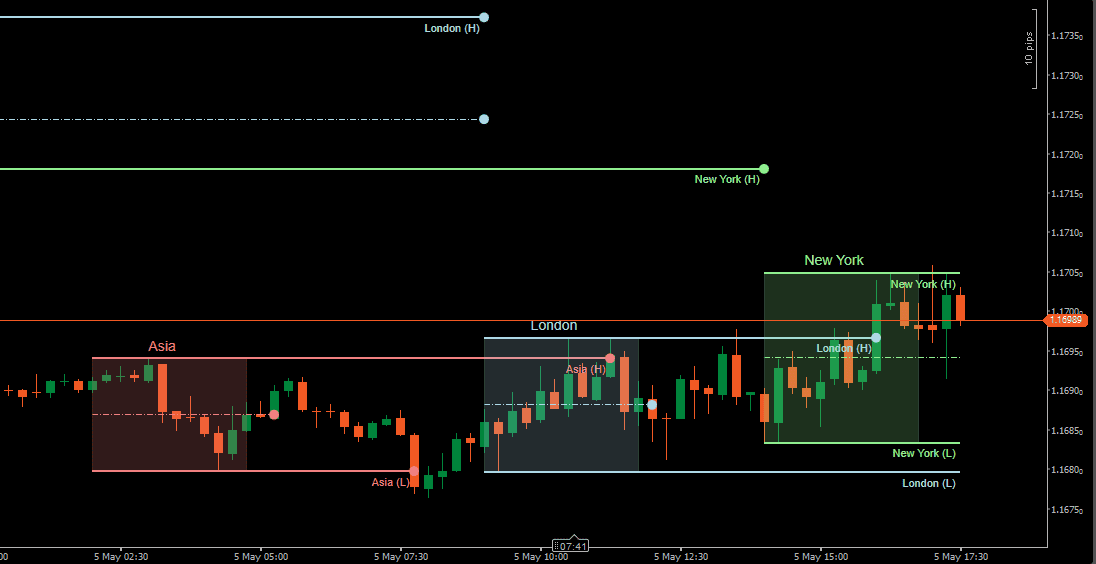
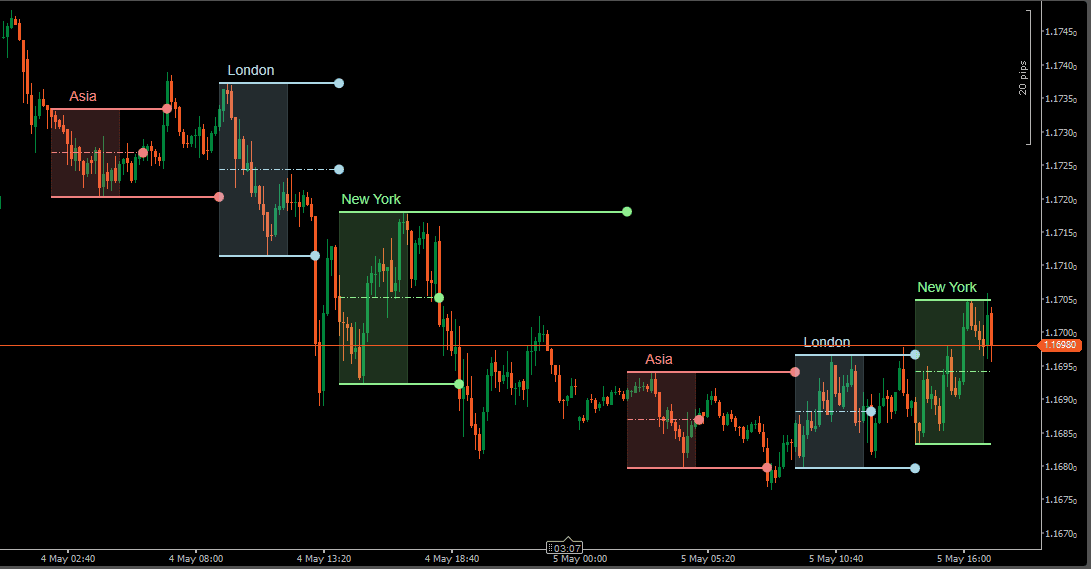
Each active Kill Zone appears as a shaded rectangle covering the configured time window. The zone builds in real time as the session progresses — its high and low boundaries update with each new bar until the session closes.
The Asia session is often treated as an initial range reference. London and New York activity is then evaluated relative to whether price respects, expands beyond, or retraces into that earlier boundary. Session transitions — particularly the London-New York overlap — are commonly watched for stronger directional moves.
Once a session ends, the High and Low pivots mark the boundaries of that session’s range. These levels often remain relevant when price returns to them during later activity — whether holding, breaking, or reacting around the prior session’s boundaries.
The Middle Pivot adds an internal reference at the midpoint of the session range. Some traders use it to evaluate whether price is accepting above or below the center of a completed session, which can provide additional context for directional analysis.
Because breakouts are confirmed only on candle close — not on wicks — pivot levels stay active longer and are less likely to be ended by brief price spikes that do not represent genuine commitment.
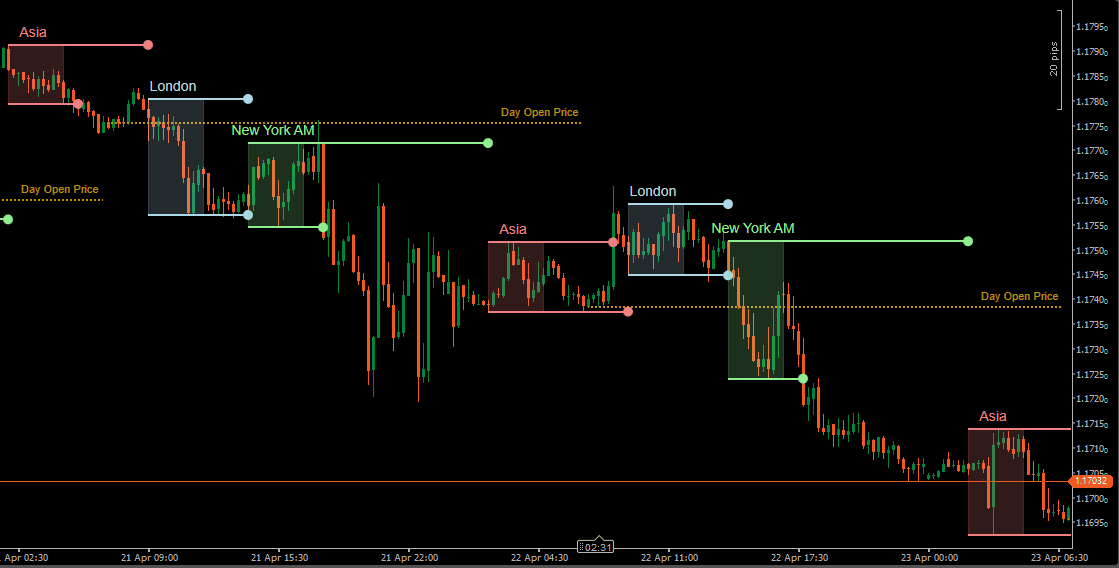
Custom pivots add a second layer of time-based reference to the chart. Where session zones show ranges, custom pivots show specific price levels captured at a chosen moment in time.
A Day Open Price pivot, for example, marks where price was at the start of the trading day and holds that level visible throughout the session. A True Day Open or NYSE Open adds additional structural context that some traders cross-reference with session behavior or order flow observations.
Because up to 10 custom pivots can be active simultaneously, it is possible to build a complete intraday reference framework — one that combines session structure with specific price anchors — directly on the chart without additional tools.
Kill Zones work best as organizational context, not as signals in themselves. The value comes from knowing when and where price is trading relative to session structure.
A few common observations traders make using this framework:
The goal is not to treat these levels as automatic signals, but to organize price behavior around time and location — and let that context inform broader analysis.

Need changes to this indicator? We can customize it to your specifications — adding new functions, modifying logic, refining visuals, or integrating it with other cTrader tools.
We also convert indicators into cBots with advanced features such as trailing stops, position parameter controls, execution filters, and rule-based automation built to your technical specifications.
Request a free consultation to discuss the technical scope, timeline, and available development options.
We are committed to the ongoing development and refinement of our indicators. If you’ve spotted a bug, feel that something essential is missing, or have ideas that could make the indicator even better, just send us a message. Your feedback helps us improve and deliver tools that truly meet traders’ needs.
A Kill Zone is a defined time window associated with increased market participation and directional activity. The concept is used in ICT and Smart Money Concepts (SMC) methodologies to separate high-activity periods from quieter hours — most commonly the London open and New York open sessions.
The indicator supports four independent session zones: Asia, London, New York, and a fully Custom session. Each can be enabled, renamed, recolored, and set to custom start and end times. All times are configured in EST.
When Pivot Extension is enabled, a session’s High and Low pivot levels continue forward after the session closes and remain visible until the next session of the same type begins — or until price closes through the pivot first.
For example, London pivots stay active until the next London session opens. If price closes beyond a pivot before that, the pivot ends at that bar. This keeps levels on the chart as long as they remain structurally relevant.
A pivot is considered broken only when a candle closes beyond it — not when price wicks through it during the bar. This close-based confirmation prevents brief price spikes from prematurely ending pivot lines, and also determines when a session boundary breakout alert fires.
Custom Pivots capture the open price at a specified time and project it as a horizontal reference level until a chosen end time. Up to 10 can be active simultaneously.
Common uses include:
Yes. Available alerts include session boundary breakouts (when price closes beyond a High or Low pivot) and middle pivot crosses. Notifications can be delivered as popup messages, sound alerts, or email. Each alert type can be enabled independently.
Kill Zone analysis is most relevant on markets that respond to session transitions — primarily Forex pairs, Gold (XAUUSD), indices, and CFDs. It is commonly applied where London and New York session opens have a visible effect on price behavior and volatility.
Basic session tools shade time windows and stop there. This indicator adds a structured layer on top: session pivot levels, middle pivot reference, pivot extension logic, close-based breakout confirmation, 10 custom time-based pivots, and alert integration — making it a broader session structure tool rather than simple chart shading.
Yes. Kill Zones are commonly used as structural context alongside other price action tools. The session framework helps answer the question of when and where — other tools can then be used to evaluate what price is doing within that context.
Session zones and pivot levels are time-based, so they appear consistently across all chart timeframes. Lower timeframes show more detailed price behavior within the zones, while higher timeframes provide a broader view of how sessions relate to each other. The preferred timeframe depends on trading style and how the session levels are being used in analysis.
Nordman Algorithms is a trade name of Nordman Algorithms OÜ (Reg. No. 14435535), registered in Tallinn, Estonia.
Software Nature & User Responsibility — Nordman Algorithms provides algorithmic software tools for technical analysis. Nordman Algorithms is not a financial advisor and is not liable for any losses. All trades conducted based on the software’s output are executed at the user’s sole discretion and risk.
Visual Markers & Signal Disclosure — This software may display visual markers (such as arrows, dots, or alerts) when predefined mathematical conditions are met. These markers are provided for educational and analytical purposes only, must not be interpreted as financial guidance, and do not constitute a recommendation to buy, sell, or hold any financial instrument. Users must independently validate all visual cues within their own trading methodology.
No Financial Advice — Nordman Algorithms does not provide discretionary trading signals, investment advice, or managed signal services. Our software represents a mathematical visualization of historical and real-time data. The appearance of a visual marker does not guarantee a profitable trade or predict future market behavior.
Trading Risk Warning — Futures, Forex, and options trading involve significant risk. Risk capital is money that can be lost without jeopardizing financial security. Only risk capital should be used for trading. Past performance is not indicative of future results. View Full Risk Disclosure: https://www.nordman-algorithms.com/risk-disclosure/
ESMA Risk Warning — Financial instruments, especially those involving leverage such as CFDs and Forex, are complex and carry a high risk of rapid financial loss. Our software provides analytical outputs and visual markers based on predefined mathematical conditions and does not mitigate or reduce inherent market risks. You should carefully consider whether you understand how leveraged financial instruments work and whether you can afford the high risk of losing your capital.
CFTC Rule 4.41 — Hypothetical or simulated performance results have inherent limitations. Unlike actual performance records, simulated results do not represent real trading. Because trades have not actually been executed, these results may under- or over-compensate for the impact of market factors such as liquidity. No representation is being made that any account will achieve profits or losses similar to those shown.