Most traders who use fair value gaps (FVGs) have heard the same rules: price has to come back to fill the gap, the gap acts as support or resistance, bigger gaps are stronger, and a limit order at the gap’s edge catches the bounce. We wanted to know which of those rules hold up in the data. So we tracked 38,114 returns to fair value gaps across four futures markets and three years, and gave each one the same test as ten random levels of the same size and distance.
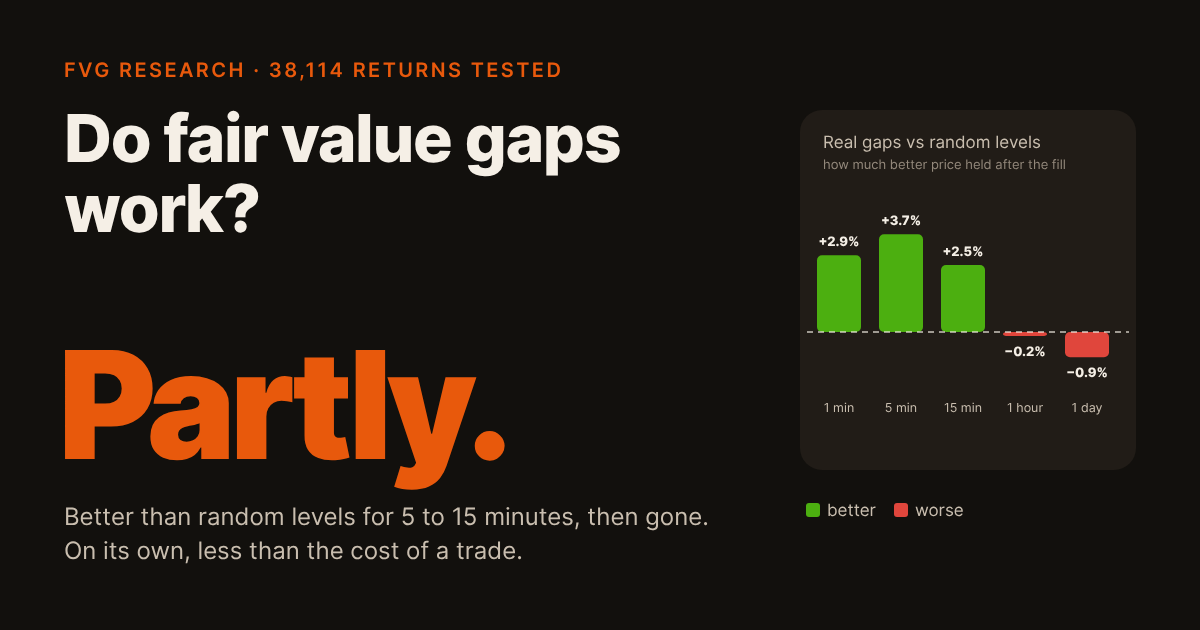
The short answer: partly. For 5 to 15 minutes after price came back, it held better at real gaps than at random levels, in all four markets and under almost any indicator settings. After an hour that advantage was gone. And most of the popular rules about gaps didn’t hold up at all.
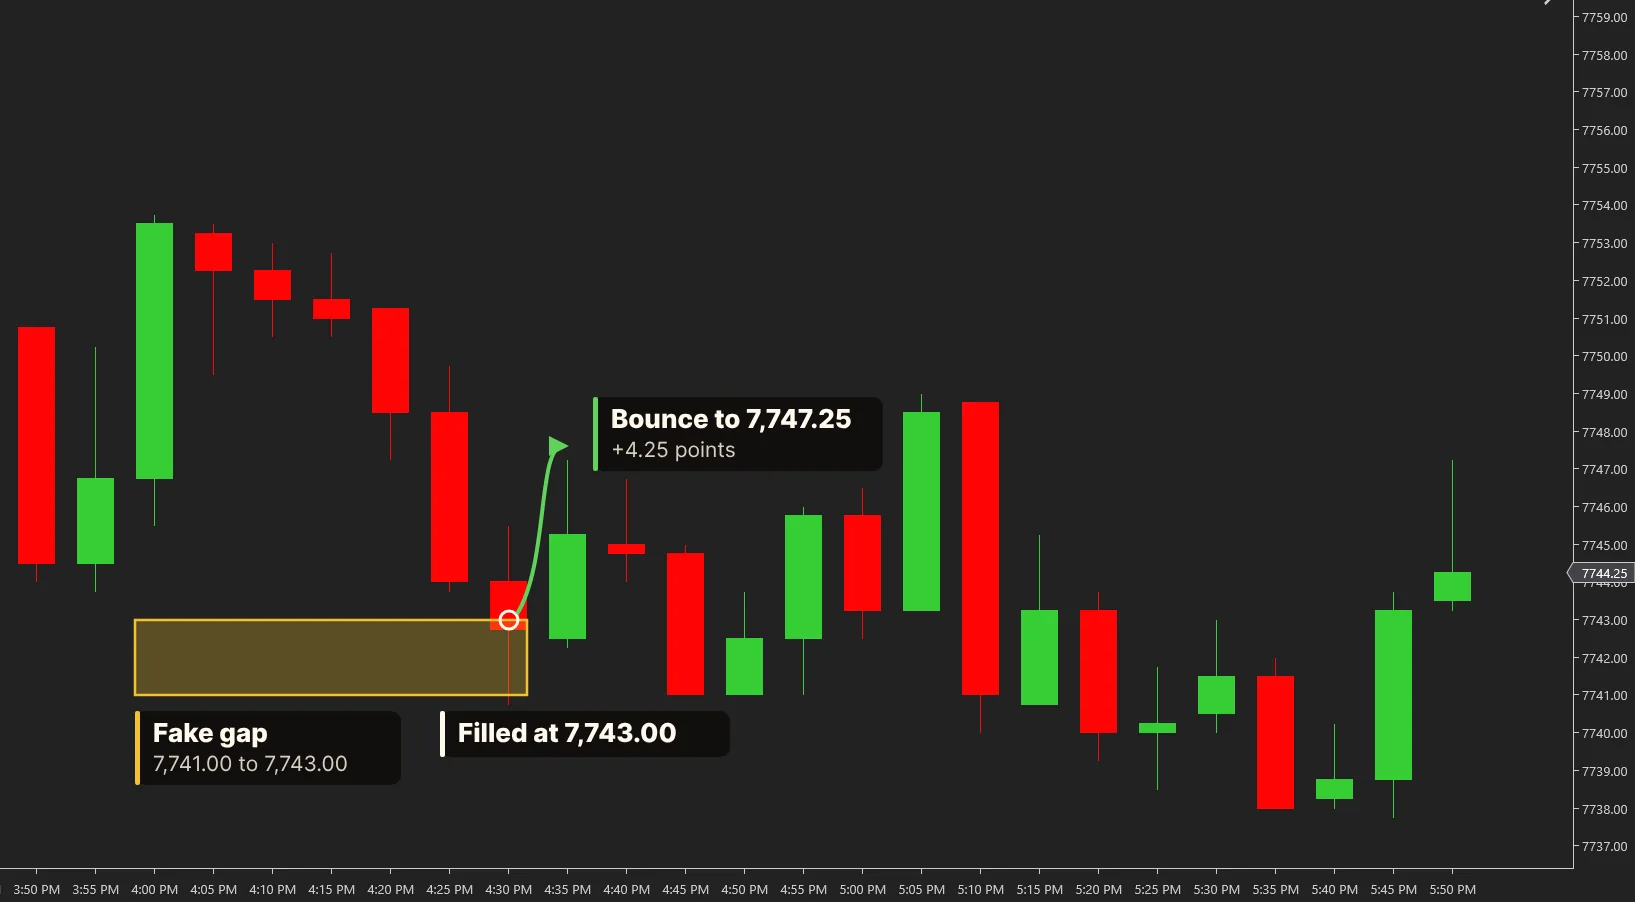
A fair value gap is a three-candle pattern left by a fast move. When price moves so quickly that the first and third candles don’t overlap, the empty space between them is the gap. In a move up, the gap runs from the first candle’s high to the third candle’s low; in a move down it is the mirror image. Traders treat that space as unfinished business: a zone price should come back to, and react at when it does.
Here is a real one from the study, on an ES 5-minute chart:
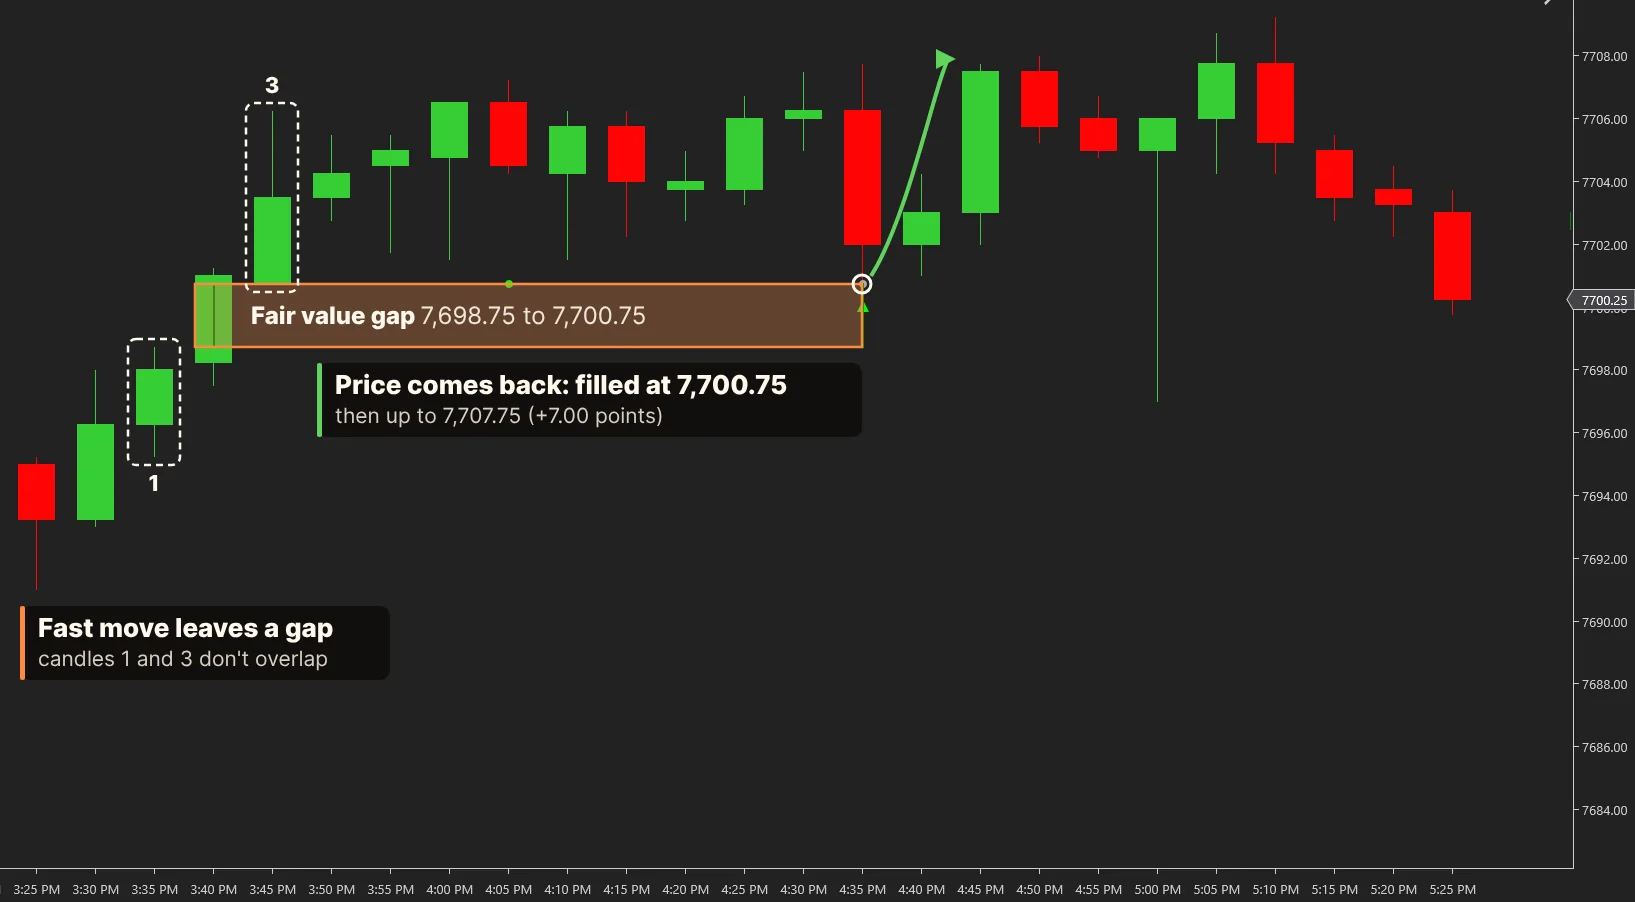
Pictures like this are why traders love gaps. But price bounces off all sorts of levels, gap or no gap. The real question is whether it bounces more at a gap than at any other level.
All gaps came from our Fair Value Gap indicator for NinjaTrader 8 on its default settings, on 5-minute charts of the E-mini S&P 500 (ES), E-mini Nasdaq-100 (NQ), Euro FX (6E) and Australian dollar (6A) futures, from October 2023 to September 2026. When price came back to a gap, we entered with a limit order at the gap’s edge.
To find out whether the gap itself adds anything, we gave every real gap ten fake twins: the same size and the same distance from price, but placed at a random time in the same hour of the day and the same month. The fakes got exactly the same entry and the same measurement. If real gaps are special, they should beat their fakes.
We didn’t use a stop or a target, because those choices alone can turn almost any entry into a winner or a loser. Instead, after every fill we measured two things:
Illustration of one long trade. The whole window counts, including what happens after the best price.
We measured both 1 minute, 5 minutes, 15 minutes, 1 hour and 1 day after the fill, on 1-minute data, in units of ATR (the market’s normal bar size), so the S&P and the euro can be compared fairly. Then we combined them into one number:
edge ratio = average MFE ÷ average MAE
An edge ratio of 1.0 is a coin toss: price went as far against you as for you. To count as better, real gaps had to beat their fakes on all markets pooled, in at least 3 of the 4 markets, in more than half of the months, and in at least 95% of 1,000 random redraws of trading days, so the difference can’t be explained by luck. We wrote these rules down before looking at any results.
Partly. At 5 and 15 minutes after the fill, real gaps passed every part of the test. At 1 minute, 1 hour and 1 day they didn’t:
| After the fill | Edge ratio, real gaps | Edge ratio, random levels | Difference | Markets where real gaps led | Passed the test |
|---|---|---|---|---|---|
| 1 minute | 1.09 | 1.06 | +2.9% | 3 of 4 | No |
| 5 minutes | 0.99 | 0.96 | +3.7% | 4 of 4 | Yes |
| 15 minutes | 1.01 | 0.99 | +2.5% | 4 of 4 | Yes |
| 1 hour | 1.00 | 1.01 | −0.2% | 2 of 4 | No |
| 1 day | 1.00 | 1.01 | −0.9% | 0 of 4 | No |
One setting can be lucky, so we reran the whole test on 384 combinations of the indicator’s settings and two chart timeframes. Then, to see what luck alone looks like, we ran the same search again with fake gaps pretending to be real ones. Each square below is one setting:
At 5 minutes, real gaps beat their fake gaps in 98% of all settings, and at 15 minutes in 98%. Fake gaps posing as real did so in 44% and 49%, just like flipping a coin. By 1 day the picture flips: real gaps trail in 97% of settings.
Try enough settings and one of them will look great. Our best (15-minute chart, Min Length 8, Duration 20, Partially) passed 4 of 5 checkpoints and beat its fakes by +14.5% at 1 minute. But the best setting on pure noise beat its fakes by +20.0%. That is why we judge the whole spread against chance, never the best result on its own.
So the gap effect is real: it shows up in every market and under almost any settings. But it is short, and it isn’t the effect most traders expect.
Here is how the five most common beliefs held up. Each one has its own section below.
| What traders believe | What the data shows | Verdict |
|---|---|---|
| “Price has to come back to fill the gap” | Price came back to 73.0% of real gaps and 72.9% of random levels | Not true |
| “The gap is support or resistance” | Better than random for about 15 minutes, gone within an hour | Partly, for 15 minutes |
| “Bigger gaps are stronger” | Gap size barely matters; timeframe and how long the gap waited matter more | Mostly not |
| “Put a limit order at the gap edge” | The best bounces are the fills you don’t get | Works on paper, less in practice |
| “An FVG is a strategy on its own” | 1 to 3 ticks better than a random level in ES and NQ: less than the cost of a trade | Not on its own |
Out of every 100 gaps, price came back to about 73, and out of every 100 random levels the same distance away, also about 73: 73.0% against 72.9%, both after a median of 5 bars.
Each circle is 1 in 100 gaps; filled means price came back to it within the gap’s life (the bar it was shown on and the 45 bars after), 5-minute charts. By market: ES 72.7% vs 72.6% · NQ 72.4% vs 72.9% · 6E 73.7% vs 73.2% · 6A 73.3% vs 73.1%.
A gap is not a magnet. Trading toward an open gap because it “has to be filled” has no support in this data.
Five minutes after the fill, price held up +3.7% better at real gaps than at random levels, and at 15 minutes it was still +2.5% better, in 4 of 4 markets. After that, the cushion fades. Within an hour it’s gone (−0.2%), and a day later real gaps do slightly worse than random levels (−0.9%).
The 5- and 15-minute leads passed the luck check; the 1-minute lead could still be luck. Hover a point for the edge ratios.
There is one more thing worth noticing in the first minute. Random levels bounce too: their edge ratio one minute after the fill was 1.06, above a coin toss. You only get filled after price has pushed into your level, and that is often right where a small pullback begins. So for a minute or so, almost any level looks like support. That is why gaps look so convincing on a chart: you see the bounce at the gap, but never the same bounce at the random levels nobody drew.
We tried every main setting of the indicator, from the minimum gap size and the chart timeframe to how long a gap waits before it’s shown and how it ends, and the result hardly moved. Try it yourself:
Pick any combination. Whatever you choose, the number barely moves: 5 minutes after the fill, 8 in 10 settings landed between +1.7% and +5.5% better than random levels.
Every combination of five indicator settings was tested on its own: 384 in total. The number is how much better real gaps did than random levels with exactly that setting. Starts on the indicator’s defaults.
How much each setting moves the result, with the other settings at their typical values:
| Setting | Weaker | Stronger | At 5 minutes | At 15 minutes |
|---|---|---|---|---|
| Chart | 5-minute | 15-minute | +2.7% → +3.8% | +1.6% → +2.6% |
| Min Length (bars before the gap is shown) | 2 | 8 | +2.9% → +3.7% | +1.8% → +2.5% |
| Mitigation | Fully | Partially | +2.8% → +3.8% | +1.9% → +2.1% |
| Duration (bars) | 20 | 100 | +2.5% → +3.4% | +1.6% → +2.0% |
| Minimum gap size | 0 × ATR | 0.25 × ATR | +2.9% → +3.4% | +1.9% → +2.1% |
Bigger minimum gaps mostly cut the number of gaps. Fifteen-minute charts, and gaps that had waited a little longer before price came back, did lean slightly higher, but every one of those differences is small. These are leanings found by searching many settings, not proof.
When price only touches your order and turns away, there’s a good chance you’re still waiting in the queue behind other orders. You don’t get filled, and you miss the very bounce you were waiting for. When price trades through your order, you do get filled, but only because it’s already moving against you.
Counting only fills where price traded 1 tick through the order cut the result from +1.31 to +0.65 ticks per trade in ES and from +2.25 to +1.23 in NQ, and turned 6E and 6A negative.
Gaps from the best setting in the grid (15-minute chart, minimum gap 0.10 × ATR, Min Length 8, Duration 20, Partially). Entry with a limit order at the gap edge; exit at the close of the minute after the fill.
| Market | Touches that never traded 1 tick through | Filled on every touch | Filled only on trade-through |
|---|---|---|---|
| ES | 10% | +1.31 ticks | +0.65 ticks |
| NQ | 2% | +2.25 ticks | +1.23 ticks |
| 6E | 21% | +0.80 ticks | −0.05 ticks |
| 6A | 21% | +0.12 ticks | −0.68 ticks |
Most backtests, including the main measurement in this study, assume a limit order is filled as soon as price touches it. For an entry at a level, that assumption flatters the result.
We took the best setting we found, entered at the gap edge with a limit order and exited at the close of the next minute, then paid for the trade: commission and fees, and a tick of slippage on the way out.
In ES and NQ a real gap earned +1.3 and +2.8 ticks more per trade than a random level. That difference is real, but it is smaller than what a trade costs. Net per trade with realistic fills: ES −$8.90, NQ −$3.37, 6E −$11.06, 6A −$12.90. Every market ends up in the red.
Cost per trade assumes $4.50 round-trip commission and fees plus 1 tick of slippage on the market exit (tick values: ES $12.50, NQ $5.00, 6E $6.25, 6A $5.00). Your costs may differ.
| Market | Real gap, before costs (fill on touch) | Random level, before costs (fill on touch) | Cost per trade | Real gap after costs, fill on touch | Real gap after costs, fill on trade-through |
|---|---|---|---|---|---|
| ES | +1.31 ticks (+$16.41) | +0.25 ticks | $17.00 | −$0.59 | −$8.90 |
| NQ | +2.25 ticks (+$11.24) | −0.58 ticks | $9.50 | +$1.74 | −$3.37 |
| 6E | +0.80 ticks (+$5.02) | +0.24 ticks | $10.75 | −$5.73 | −$11.06 |
| 6A | +0.12 ticks (+$0.61) | −0.03 ticks | $9.50 | −$8.89 | −$12.90 |
The difference between a real gap and a random level is real. It is just smaller than what a trade costs.
A fair value gap marks a place where price is a little more likely to pause for a few minutes. That’s real, and it shows up in every market we tested. But it isn’t a magnet, it isn’t a swing level, and on its own it isn’t enough to pay for a trade. Think of gaps as a map rather than a trigger:
One more pattern turned up while we were looking through the results. 21% of the returns were to gaps left by the move that broke market structure. Those scored an edge ratio of 1.08 at 15 minutes and 1.08 at 1 hour, against 0.99 and 1.01 for their own fake gaps, while gaps as a whole had already lost their lead by 1 hour.
Default settings, 5-minute charts, all four markets. This came from looking at the results, not from rules set in advance, which is exactly how chance patterns appear. Treat it as a side note, not a finding.
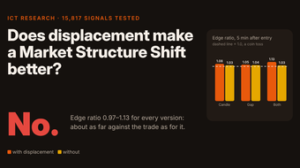
Two studies in, a pattern is showing. Study 1 tested a signal, the Market Structure Shift: with or without displacement, price went about as far against the trade as in its favour. Study 2 tested a zone, the fair value gap: price did react there more than at random levels, even if only briefly.
So zones are where an effect shows up. The test we built for this study, real zones against fake zones of the same size and distance, works for any indicator that draws zones on a chart. Next, we’ll put order blocks through exactly the same test: does price react at an order block more than at a random level, and for how long?
Test it on your own market. Every gap in this study came from the Nordman Fair Value Gap indicator for NinjaTrader 8; its default settings match the main test.
See the Fair Value Gap Indicator →Partly. Across 38,114 returns to fair value gaps in ES, NQ, 6E and 6A futures, price held better at real gaps than at random levels of the same size and distance for 5 to 15 minutes after the return: by +3.7% at 5 minutes and +2.5% at 15 minutes. After an hour the advantage was gone, and on its own it was smaller than the cost of a trade.
No. Price came back to 73.0% of real gaps within their life, and to 72.9% of random levels the same distance away. Gaps get filled about as often as any other level, so a gap is not a magnet.
About 15 minutes in this study. The advantage of real gaps over random levels peaked 5 minutes after price came back, was smaller at 15 minutes, was gone within an hour, and after a day real gaps did slightly worse than random levels.
Not much. Of all the indicator’s settings, the minimum gap size changed the result least; bigger minimums mostly cut the number of gaps. Fifteen-minute charts and gaps that waited longer before price came back leaned slightly better.
Be careful with backtests that fill on a touch. When fills required price to trade one tick through the order, the result per trade dropped by about half in ES and NQ and turned negative in 6E and 6A, because the touches that bounce hardest are the ones least likely to fill.
The average maximum favourable excursion (MFE) divided by the average maximum adverse excursion (MAE), over every trade, in ATR units. 1.0 means price went as far against the trade as for it, a coin toss; above 1.0, the entries offered more potential than risk.
Data. E-mini S&P 500 (ES), E-mini Nasdaq-100 (NQ), Euro FX (6E) and Australian dollar (6A) futures from Kinetick, back-adjusted continuous contracts, full electronic session, 1 October 2023 to 30 September 2026. Returns to real gaps per market: ES 8,962, NQ 9,531, 6E 9,633, 6A 9,988.
Gaps. Nordman Fair Value Gap indicator 2.1 for NinjaTrader 8 on its defaults: 5-minute charts, minimum gap 0.10 × ATR(14), shown after Min Length 5 bars, Duration 50 bars, ends on the first touch (Partially). Rebuilt in Python and checked to match NinjaTrader on every gap.
Entry and measurement. A limit order at the gap’s near edge, filled on 1-minute data when price reaches it. From the fill: MFE and MAE in ATR(14) of the bar before the fill, at 1, 5, 15 and 60 minutes and 1 day. Inside the fill minute, only the adverse move counts. Edge ratio: average MFE divided by average MAE, over all returns.
Fake gaps. Ten per real gap, with the same size and distance from price in ATR, placed at a random bar in the same New York hour and month, given the same life, entry and measurement: 380,599 fake returns in total.
Rule, set before the test. Real gaps count as better only if their edge ratio is higher than the fakes’ on all markets pooled, in at least 3 of 4 markets, in more than half of the months, and in at least 95% of 1,000 redraws of trading days. They passed at 5 and 15 minutes. By the strict standard we set in advance (3 of 5 checkpoints), an FVG is not an edge on its own.
Settings grid and costs. 384 settings (gap size, Min Length, Duration, mitigation, 5- and 15-minute charts), each against its own fake gaps, plus a chance run in which one extra fake gap per real gap posed as real. Ticks, dollars and the trade-through rule were measured on the best setting only. These were explored after the main test on the same data, so they are leanings, not proof; we did not retest them on a separate period.
Research and text by Alexei Kuntysh, founder of Nordman Algorithms, a team that builds indicators, strategies and trade copiers for NinjaTrader, MetaTrader, cTrader and TradingView. Alexei has built trading software since 2008. Gaps were generated with the Nordman Fair Value Gap indicator and measured with our own analysis code on historical data.
Nordman Algorithms provides software infrastructure for trade automation and does not offer financial advice, trading signals, or managed trading services. The results in this study are hypothetical: they are calculated from historical market data by fixed rules, the cost figures are assumptions, and they don’t represent actual trading or guarantee future results. Fair value gaps do not constitute a recommendation to buy, sell, or hold any instrument. This article is for informational and educational purposes only. Trading futures involves substantial risk of loss. See our risk disclosure.