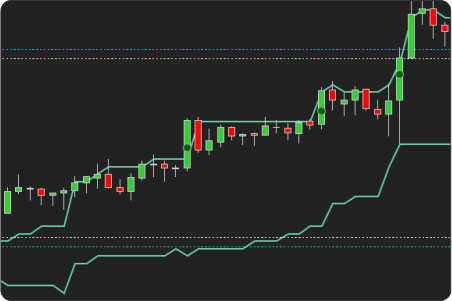
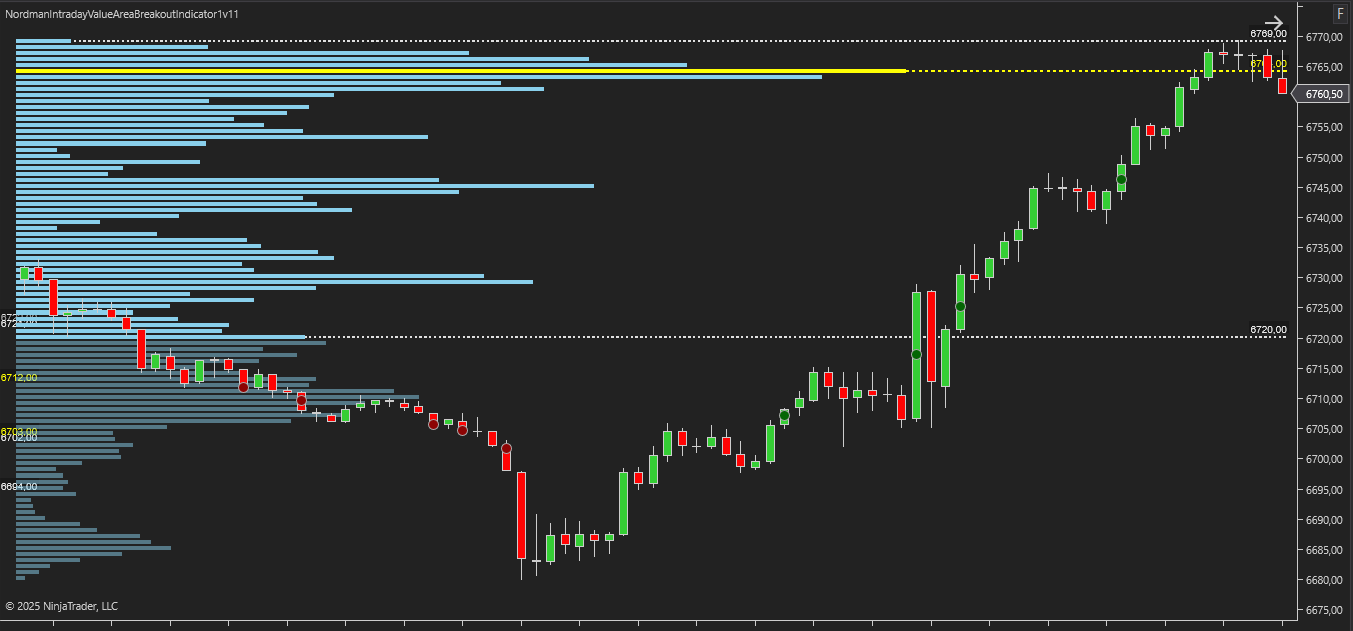
NinjaTrader Intraday Value Area Breakout Indicator is designed to analyze and track breakouts of Value Area High (VAH) and Value Area Low (VAL) within the current period — such as a session, day, week, or a custom-defined time range.
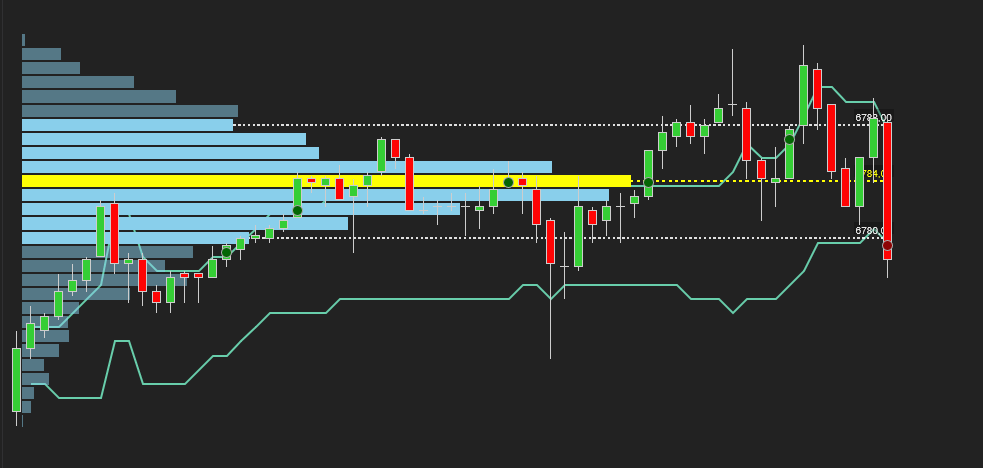
The indicator visualizes the evolving Value Area, displays the Volume Profile, and detects breakout events of VAH and VAL levels in real time. Unlike approaches based on previous-period levels, this tool works with the current market structure, allowing traders to observe how Value Area zones shift and develop as the session unfolds.
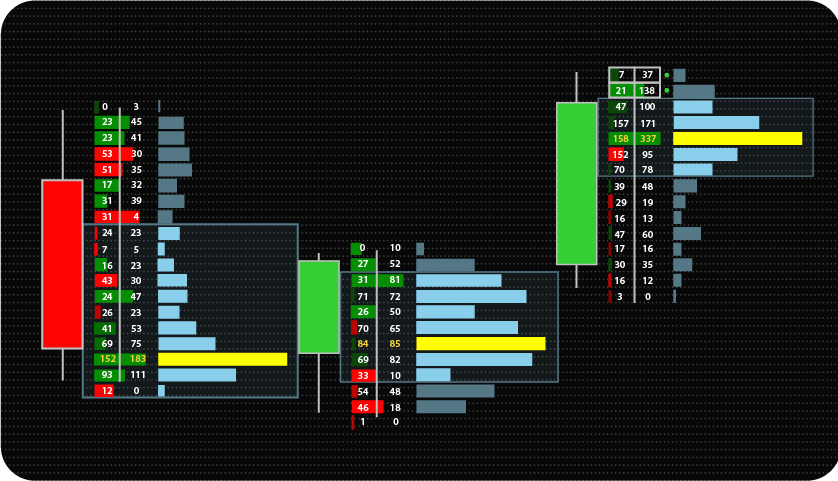
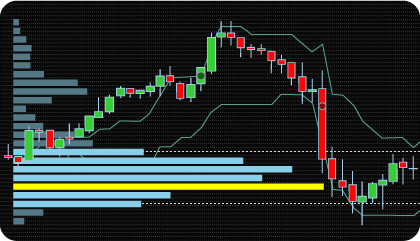
Volume distribution across price levels reflects the balance of power between buyers and sellers. One of the key elements of the Volume Profile is the Value Area — the price range that contains roughly 70% of the total traded volume for the selected period.
The Value Area consists of:
These levels indicate where most trading activity has taken place. When price moves beyond VAH or VAL, it often reflects a potential transition from balance to directional movement. Breakouts through these levels are frequently associated with the development of intraday impulses or short-term shifts in market direction.
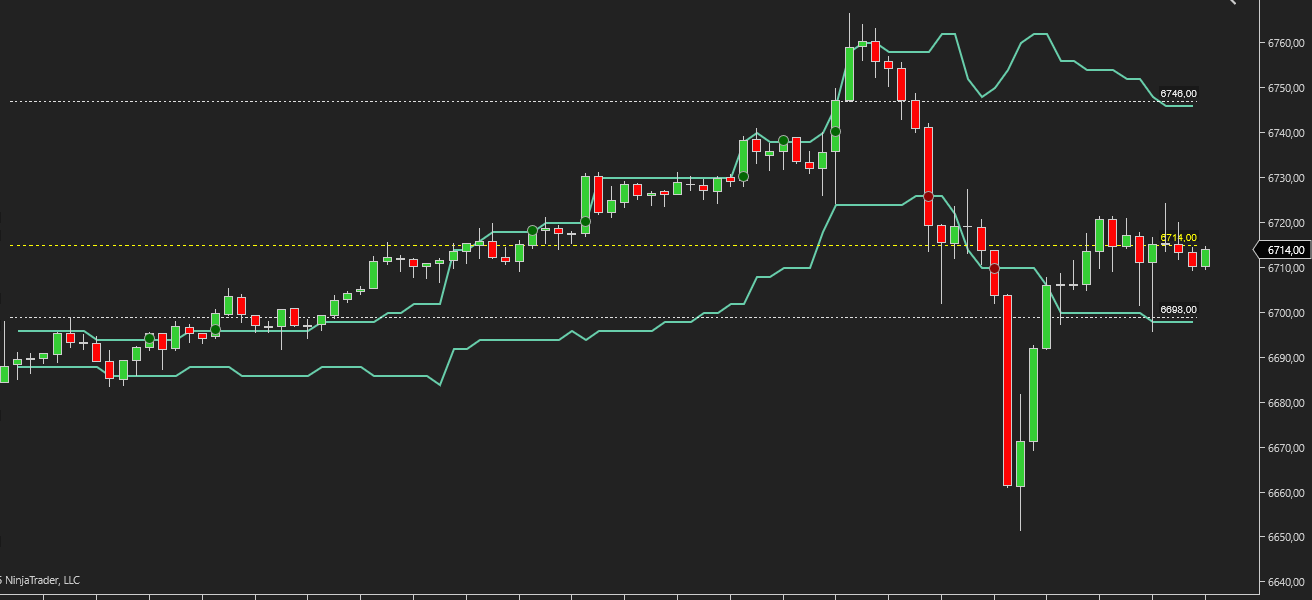
Value Area Breakout Indicator for NinjaTrader identifies the moments when price first crosses the current VAH or VAL levels.. Unlike static levels from previous periods, current VA levels are calculated dynamically as volume accumulates during the session.
Such breakouts reflect intra-session changes in supply and demand structure and allow traders to detect shifts in market context as they happen.
With this indicator, traders can observe:
Analyzing the current Value Area makes it possible to identify impulses and volume redistribution in real time. A breakout of VAH or VAL during the current period may indicate:
Value Area Breakout Indicator is an analytical tool that helps pinpoint where, within the current period, the market begins to change its state. It does not predict future movement but identifies the transition from balance to impulse — a critical phase where potential shifts in intraday market state can be identified for further analysis.
The NinjaTrader Intraday Value Area Breakout Indicator allows traders to track and interpret breakouts of the current period’s Value Area, providing technical data on volume distribution evolution and highlighting areas of potential directional momentum.
The NinjaTrader Intraday Value Area Breakout Indicator provides practical and flexible tools, allowing traders to adjust settings for different trading styles and market conditions. These features include:
Calculation Type — Up Down Tick and Bid Ask
The indicator supports two methods for classifying volume between buying and selling pressure when building the Volume Profile.
Up Down Tick — classifies volume based on tick direction. Up ticks are treated as buying pressure, down ticks as selling pressure. This mode works with standard tick data and does not require Tick Replay.
Bid Ask — classifies volume based on where orders are filled relative to the bid/ask spread. Volume filled at or above the ask is treated as buying pressure; volume filled at or below the bid as selling pressure.
This mode requires Tick Replay to be enabled in the Data Series settings and a data provider that supplies bid/ask tick data. Without Tick Replay, this mode will not function correctly.
Breakout Detection Modes: Live and Locked
The indicator supports two distinct detection modes — Live and Locked. Each mode utilizes a specific calculation logic suited for different analytical styles.
In both modes, a new breakout marker is generated only if the price fully returns within the Value Area and subsequently executes a new breakout.
Live Mode — Detecting Breakouts on the Current Bar
In Live Mode, the indicator identifies a VAH or VAL breakout at the moment of occurrence on the current bar. Visual markers appear instantly when price crosses the level. However, since VA levels are calculated dynamically, they may shift during the formation of the same bar as new volume accumulates. If a level shifts beyond the current price point before the bar closes, the marker may adjust or disappear.
Live Mode is designed for real-time observation of intraday breakouts, allowing traders to monitor emerging movements as they develop. This makes it particularly effective for active market analysis and strategies requiring immediate data updates.
| Advantages | Characteristics |
| Fast reaction to changes in market structure. | Markers may adjust due to real-time VA recalculations. |
| Ability to enter early, at the start of a potential impulse. | Some breakouts may not be sustained if price quickly returns to the Value Area. |
| Well-suited for active intraday traders. | Optimal when used with additional volume or threshold filters. |
Locked Mode — Breakouts Based on Fixed VA Levels of the Previous Bar
In Locked Mode, breakouts are determined using VAH and VAL levels that were fixed at the close of the previous bar. Unlike Live Mode, where levels can shift as the bar develops, Locked Mode relies on static values, providing a stable environment for breakout detection and eliminating the “floating level” effect.
Locked Mode is ideal for traders who prefer working with clearly defined, non-changing reference points. This approach produces consistent directional markers based on fixed price levels, which is especially useful during periods of high volatility and rapid profile expansion.
| Advantages | Characteristics |
| Fixed VAH/VAL levels prevent marker redefinition during profile adjustments. | Detections are based on static previous-bar levels for enhanced stability. |
| Reduced frequency of markers caused by minor VA shifts. | Integrates seamlessly with volume filters and threshold settings. |
| Provides consistent and easy-to-interpret analytical data. | Ideal for analyzing breakouts relative to established reference levels. |
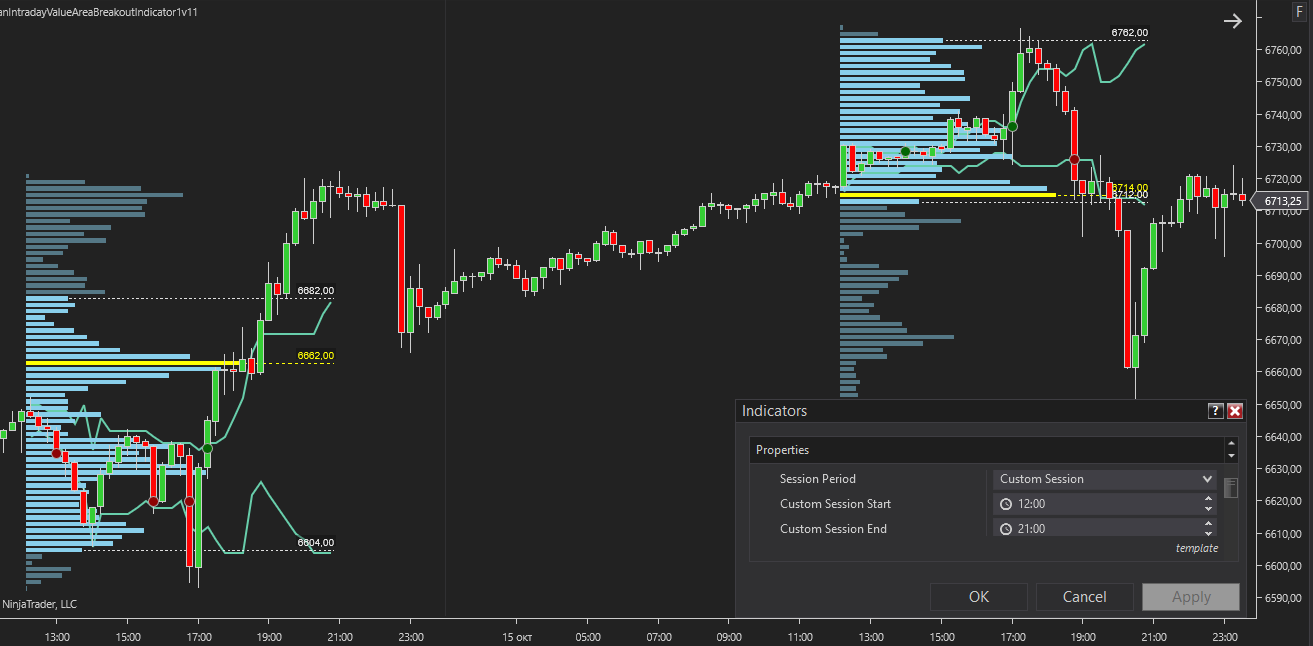
Flexible Value Area Period Configuration
The indicator supports flexible Value Area period settings: standard (session, day, week) or custom. In custom mode, traders can define start and end times down to the minute, allowing precise adaptation to specific trading windows and strategies.
The Bars mode calculates the Value Area over a fixed number of bars instead of a time-based period. The number of bars per calculation period is set via the Value Area Bars parameter (default: 50).
The Sessions parameter controls how many consecutive periods are combined into a single accumulated Volume Profile before a new calculation begins. At the default value of 1, each period is calculated independently. Setting Sessions to 2 or 3 merges that number of periods into one profile — for example, Sessions = 2 with the Day period builds a Volume Profile covering two full trading days. This works across all period types including Session, Day, Week, Custom Session, and Bars.
Threshold Condition for Breakout Filtering
The indicator includes a Threshold setting that defines the minimum distance price must travel beyond VAH or VAL for a breakout to be confirmed and a visual marker to appear. This is designed to filter out minor level touches and reduce the impact of weak price fluctuations, allowing the observer to focus on more significant structural moves.
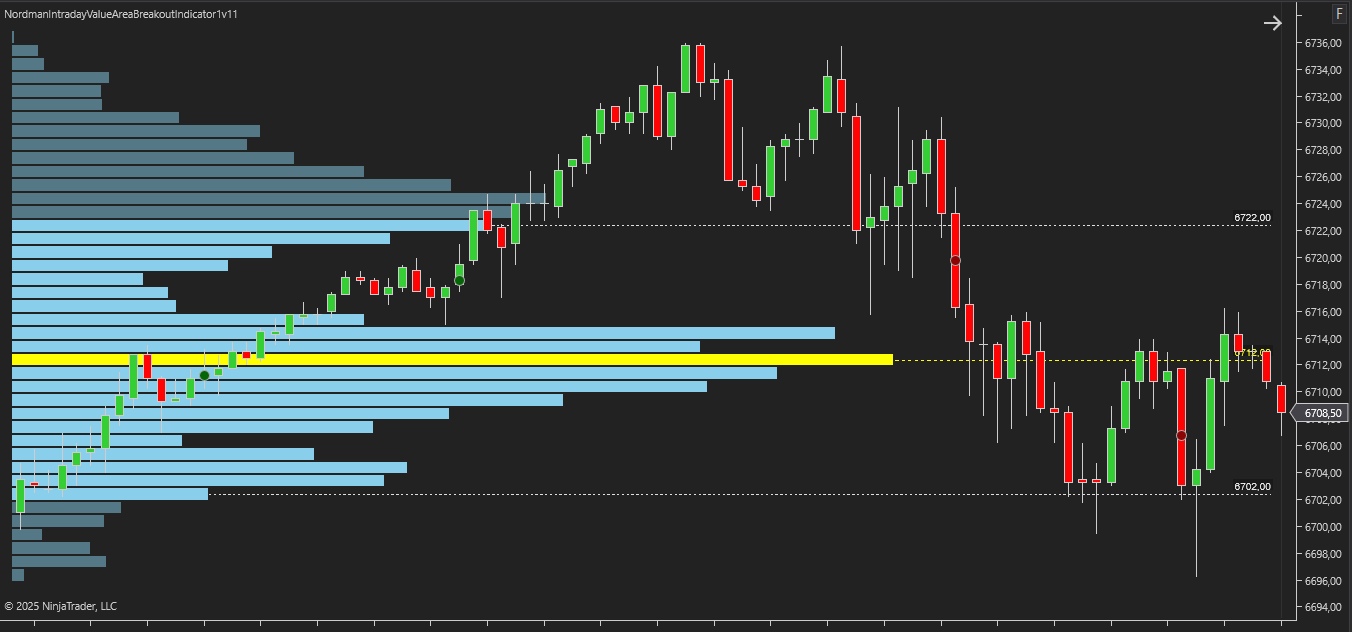
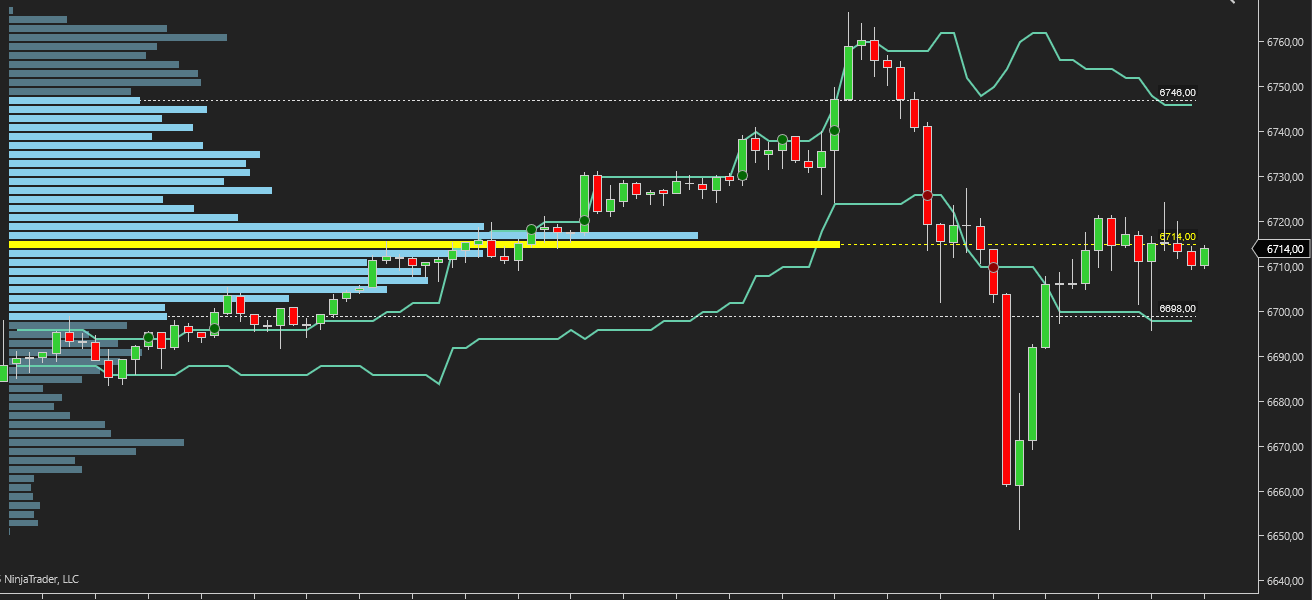
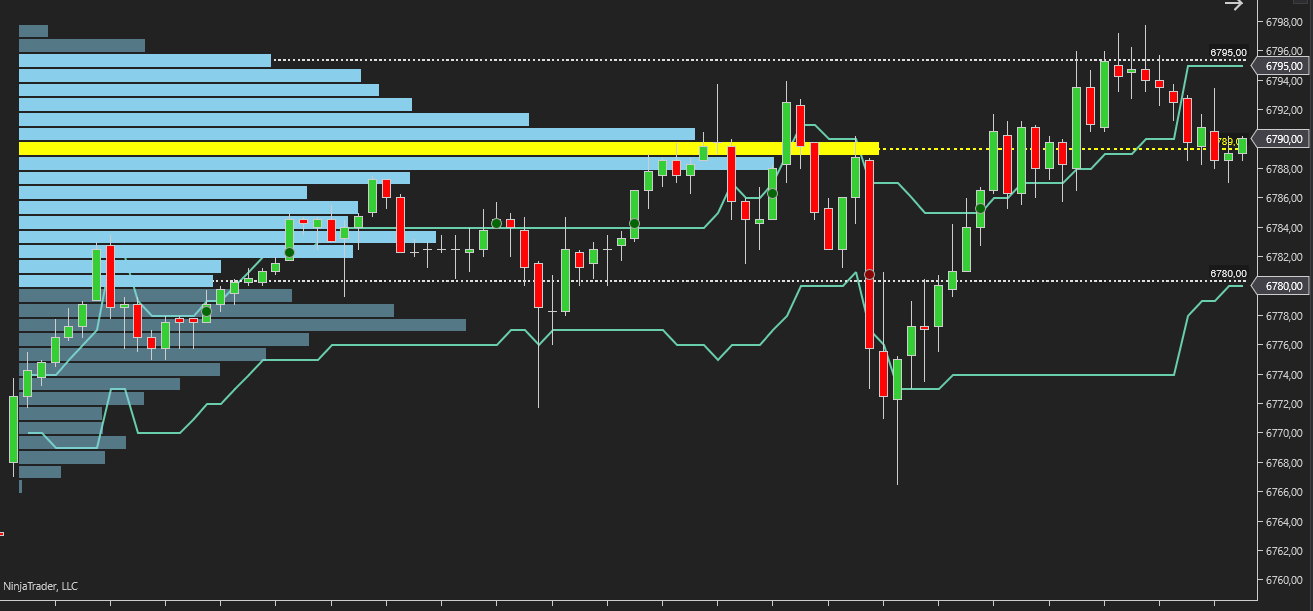
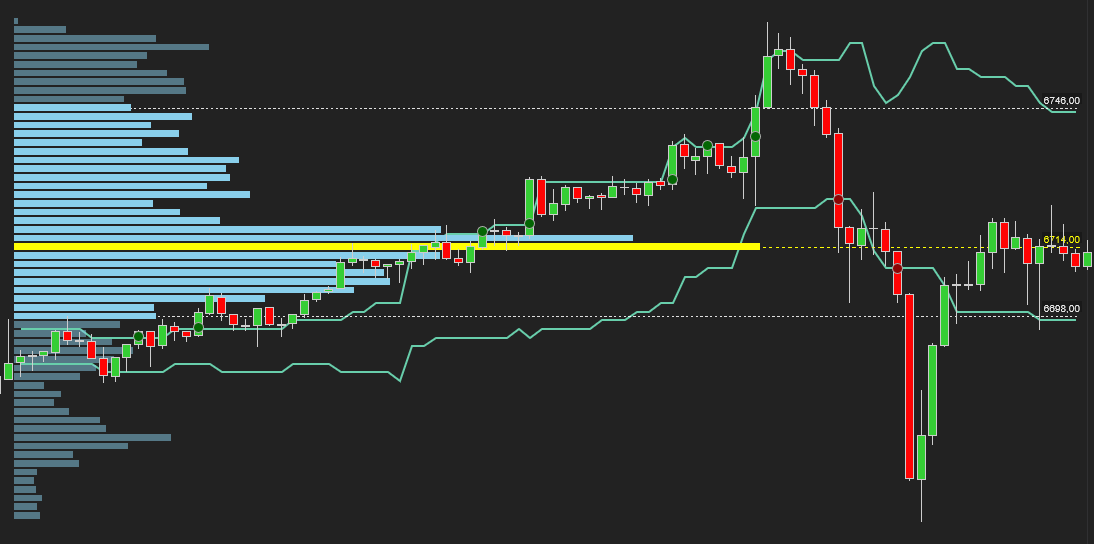
Volume Profile and VA Dynamics Visualization
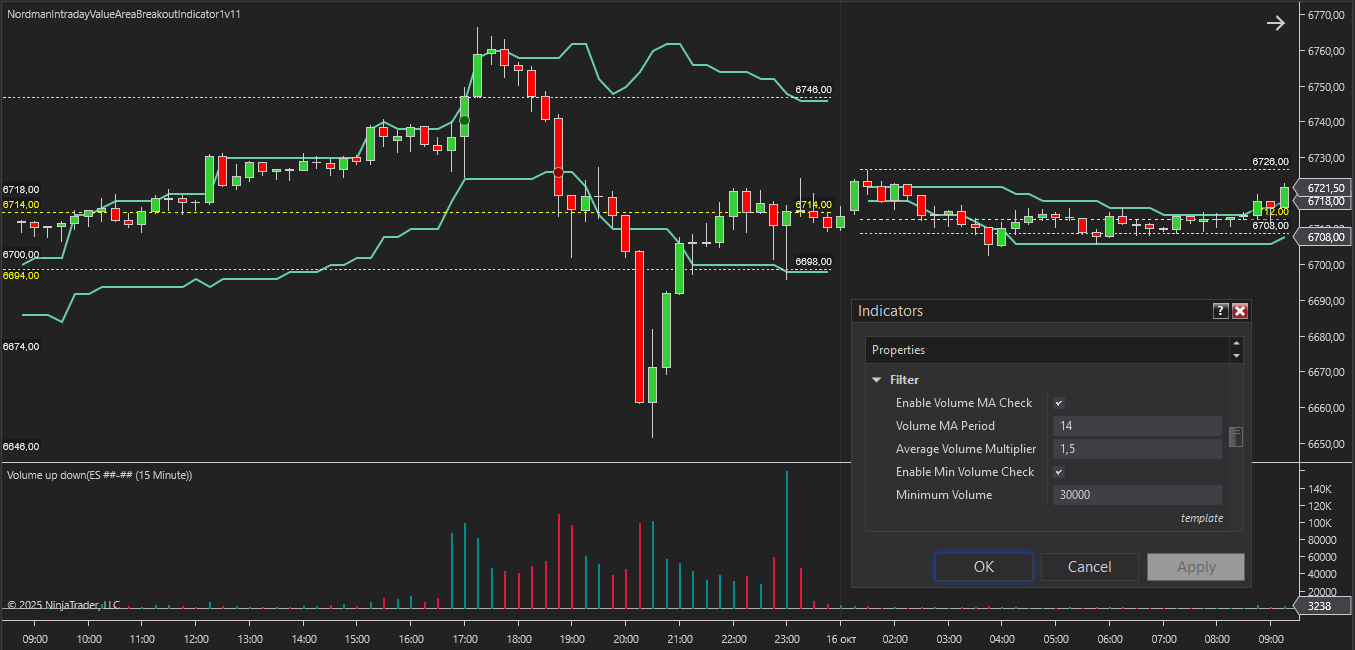
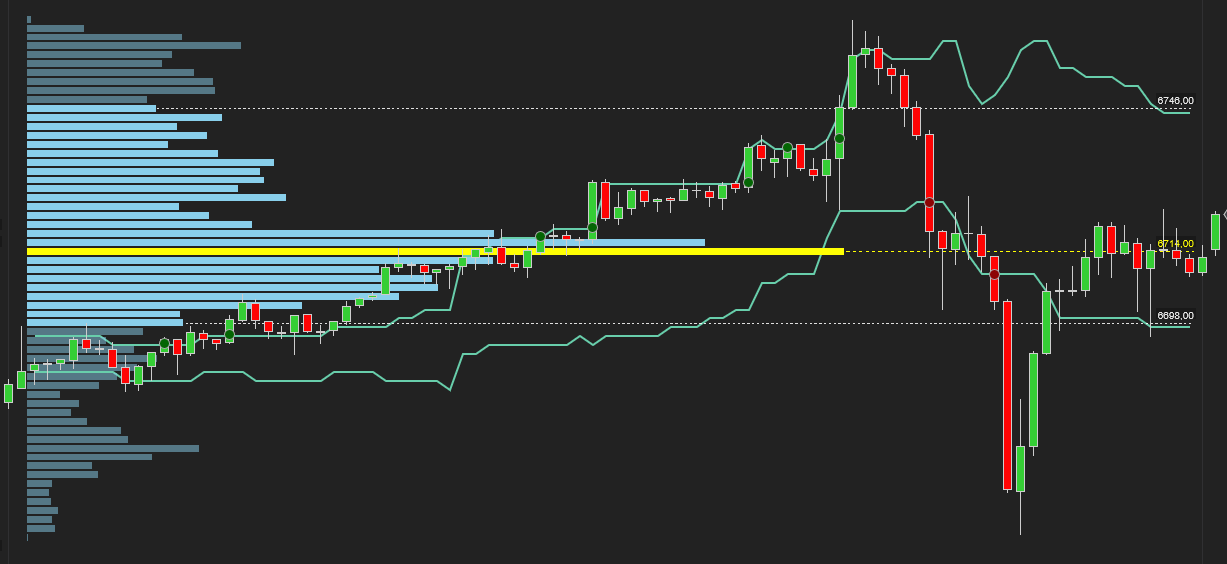 The indicator displays the Volume Profile, VAH and VAL levels, and their evolution over time. Historical VA lines show how the Value Area develops as the session unfolds. All visual components can be toggled on or off, giving traders full control.
These visual tools help traders understand not only current levels but also how they formed, adding valuable market context.
Additional Analytical Filters
The indicator supports additional filters to refine breakout detection and ensure alignment with broader market conditions:
The indicator has the following parameters:
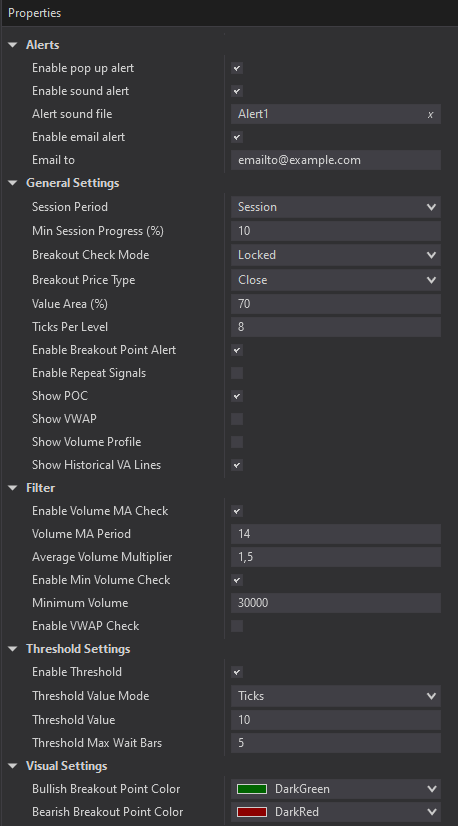
Alerts – Configure various types of alerts.
Session Period — Defines the period used for Value Area calculation: Bars, Custom Session, Session, Day, or Week.
Calculation Type — Selects the volume classification method for the Volume Profile: Up Down Tick (standard tick direction) or Bid Ask. Bid Ask mode requires Tick Replay to be enabled in the Data Series settings.
Value Area Bars — Defines the number of bars in each calculation period when the Bars period mode is selected. Default value is 50.
Sessions — Defines how many consecutive periods are merged into a single Volume Profile calculation. Default is 1 (each period calculated independently). Higher values accumulate volume across multiple periods before starting a new profile.
Min Session Progress (%) – Specifies the minimum session progress (in %) required before the indicator starts detecting breakout signals. This helps avoid signals during the early session phase when price ranges are still forming, market direction is unclear, and breakouts are often weak or unreliable.
Breakout Check Mode – breakout detection mode: Live (current bar) or Locked (previous bar fixed levels).
Breakout Price Type – price type for breakout confirmation: Close or High/Low.
Value Area (%) – Sets the percentage of total volume that defines the Value Area. The default is typically 70%, but this can be adjusted to match different volume profile methodologies.
Ticks Per Level – Determines the number of price ticks aggregated into one Volume Profile level. A higher value creates a coarser profile, while a lower value provides finer granularity.
Enable Repeat Signals – Enables repeated breakout signals if another breakout occurs on the following bar. Signals will continue until price closes back inside the Value Area. When disabled, this parameter prevents excessive signal duplication.
Show POC — Enables or disables the display of the Point of Control line on the chart independently of other visual elements.
Show VWAP — Enables or disables the VWAP line display. When active, the line color changes dynamically — green when price is above VWAP, red when below.
Enable Volume MA Check – Activates the average volume filter, allowing breakout signals only if bar volume exceeds a calculated average volume threshold.
Volume MA Period – Defines the lookback period used to calculate average volume for the volume filter.
Average Volume Multiplier – Sets the multiplier applied to the average volume. A signal is valid only if the current bar’s volume exceeds (Average Volume × Multiplier).
Enable Min Volume Check – Enables the minimum volume filter, requiring bar volume to exceed a fixed minimum level for a breakout signal to be valid.
Enable VWAP Check – Activates the VWAP filter, which verifies that price is above or below VWAP depending on breakout direction, helping confirm breakout strength.
Enable Threshold – Enables the Threshold filter, which requires price to move beyond VAH or VAL by a specified amount before confirming a breakout.
Threshold Value Mode – unit of measurement for threshold: percent, ticks, points.
Threshold Value – Specifies the required distance price must travel beyond VAH or VAL according to the selected Threshold Value Mode.
Threshold Max Wait Bars – sets the maximum number of bars allowed for price to reach the defined Threshold Value after a VA breakout. A value of 0 means only the current bar is considered, while 5 allows up to 5 bars after the breakout to meet the threshold.

We can customize this indicator to your needs — adding functions, modifying logic, or integrating it with other tools for your workflow.
We also convert indicators into Automated Trading Strategies with advanced functions (trailing stops, risk management, filters) tailored to your trading style strictly according to your specifications.
Request a free consultation to discuss the technical scope and timeline of your project.
We are committed to the ongoing development and refinement of our indicators. If you’ve spotted a bug, feel that something essential is missing, or have ideas that could make the indicator even better, just send us a message. Your feedback helps us improve and deliver tools that truly meet traders’ needs.
The indicator provides a set of exposed analytical plot outputs designed for structured integration with third-party strategy builders and automation tools such as BloodHound and BlackBird (SharkIndicators), as well as other algorithmic trading environments.
| Analytical Plot Name | Output Values |
| BullishBreakoutPoint | Value |
| BearishBreakoutPoint | Value |
| VahHistory | Value |
| ValHistory | Value |
| Poc History | Value |
| VWAP | Value |
| VolAvg | Value |
Plot output names and descriptions are technical identifiers intended solely for software integration purposes and do not constitute trading advice, signals, or recommendations.
Nordman Algorithms is a trade name of Nordman Algorithms OÜ (Reg. No. 14435535), registered in Tallinn, Estonia.
Software Nature & User Responsibility — Nordman Algorithms provides algorithmic software tools for technical analysis. Nordman Algorithms is not a financial advisor and is not liable for any losses. All trades conducted based on the software’s output are executed at the user’s sole discretion and risk.
Visual Markers & Signal Disclosure — This software may display visual markers (such as arrows, dots, or alerts) when predefined mathematical conditions are met. These markers are provided for educational and analytical purposes only, must not be interpreted as financial guidance, and do not constitute a recommendation to buy, sell, or hold any financial instrument. Users must independently validate all visual cues within their own trading methodology.
No Financial Advice — Nordman Algorithms does not provide discretionary trading signals, investment advice, or managed signal services. Our software represents a mathematical visualization of historical and real-time data. The appearance of a visual marker does not guarantee a profitable trade or predict future market behavior.
Trading Risk Warning — Futures, Forex, and options trading involve significant risk. Risk capital is money that can be lost without jeopardizing financial security. Only risk capital should be used for trading. Past performance is not indicative of future results. View Full Risk Disclosure: https://www.nordman-algorithms.com/risk-disclosure/
ESMA Risk Warning — Financial instruments, especially those involving leverage such as CFDs and Forex, are complex and carry a high risk of rapid financial loss. Our software provides analytical outputs and visual markers based on predefined mathematical conditions and does not mitigate or reduce inherent market risks. You should carefully consider whether you understand how leveraged financial instruments work and whether you can afford the high risk of losing your capital.
CFTC Rule 4.41 — Hypothetical or simulated performance results have inherent limitations. Unlike actual performance records, simulated results do not represent real trading. Because trades have not actually been executed, these results may under- or over-compensate for the impact of market factors such as liquidity. No representation is being made that any account will achieve profits or losses similar to those shown.
Trademark Notice — NinjaTrader® is a registered trademark of NinjaTrader Group, LLC. No NinjaTrader company has any affiliation with the owner, developer, or provider of the products or services described herein, or any interest, ownership or otherwise, in any such product or service, or endorses, recommends or approves any such product or service.