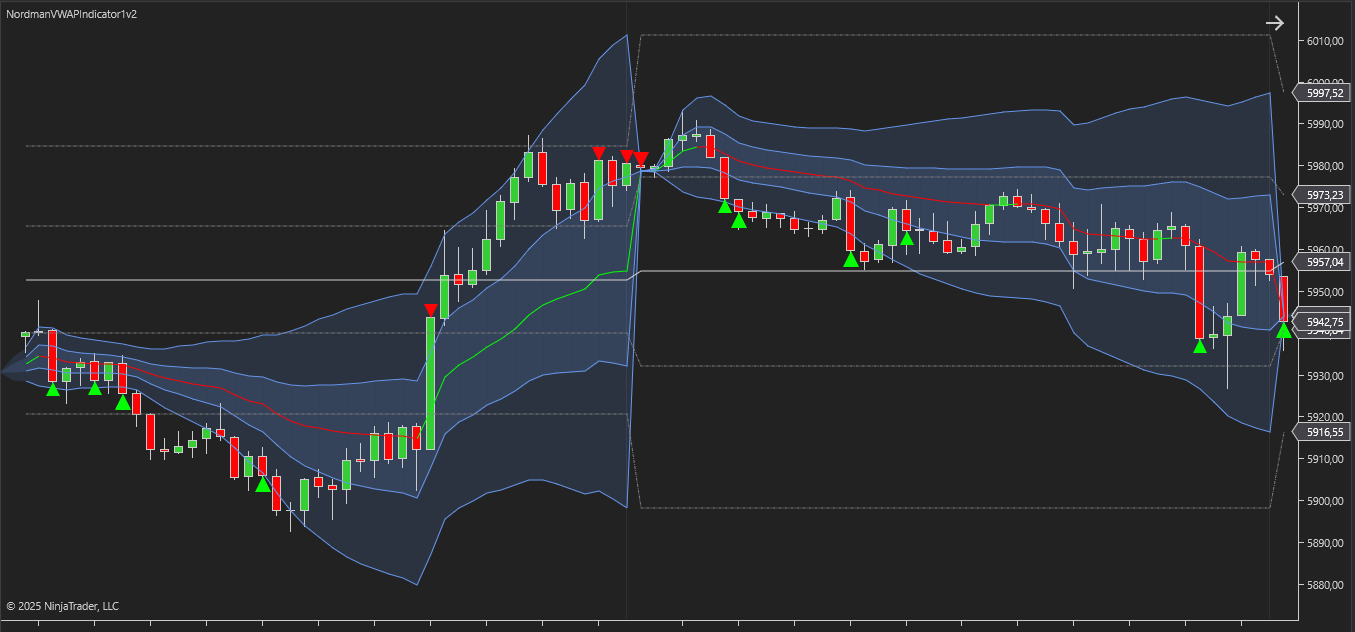
The VWAP Indicator for NinjaTrader is a dynamic technical analysis tool designed to display the average price of an asset over a specified period, weighted by trading volume. Unlike simple moving averages, which treat all price data equally, VWAP offers a volume-adjusted perspective on price levels where the most trading activity has occurred.
From a practical standpoint, VWAP (Volume Weighted Average Price) is widely used by traders to interpret real-time market behavior relative to traded volume. It helps traders see how price behaves relative to trading volume and highlights areas where price and volume interact during the session. The core concept of VWAP is simple: when price trades above the VWAP line, transactions occur above the session’s average traded price. Conversely, price trades below VWAP, transactions are occurring below the session’s average traded price. If price fluctuates around the VWAP line, it may reflect a neutral or sideways market phase without a clear directional orientation.
In addition to identifying market direction, the VWAP indicator serves as a dynamic support and resistance level during the trading session. When price approaches the VWAP line from above, the level often acts as a reference area where price interacts with the session’s average price. When price approaches VWAP from below, the level may act as a reference boundary where price interacts with the session’s average price.
Traders often watch for VWAP crossovers—moments when price moves above or below the VWAP line—as these events show a change in price positioning relative to the session’s average price. A move above or below VWAP reflects a change in price positioning compared to the volume-weighted benchmark.
The VWAP Indicator for NinjaTrader is a comprehensive tool for intraday and volume-based analysis. It helps traders analyze how price interacts with the session’s average traded price and observe key reference levels during the trading session. Its simplicity, combined with volume awareness, makes VWAP a foundational component for volume-based market analysis.
Compared with basic VWAP implementations, the NinjaTrader VWAP Indicator includes several additional configuration options designed to support different analytical workflows. These include:
Extended Selection of Calculation Periods
Traders can apply VWAP not only to the current trading session but also to other available calculation periods, such as daily, weekly, monthly, quarterly, or yearly.
Custom Calculation Period
One of the flexible and convenient additional features of this indicator is the ability to set an exact start and end time for any custom VWAP calculation. This allows traders to analyze VWAP values within a precisely defined time window.
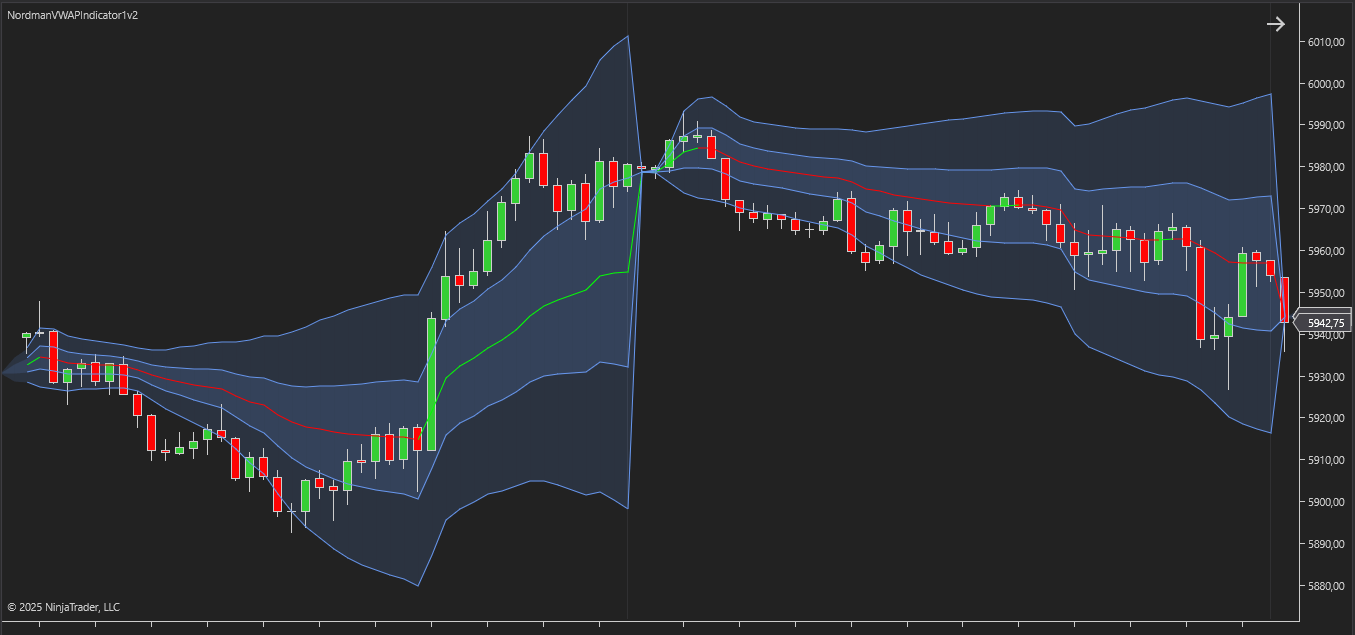
Customizable Deviation Bands Settings
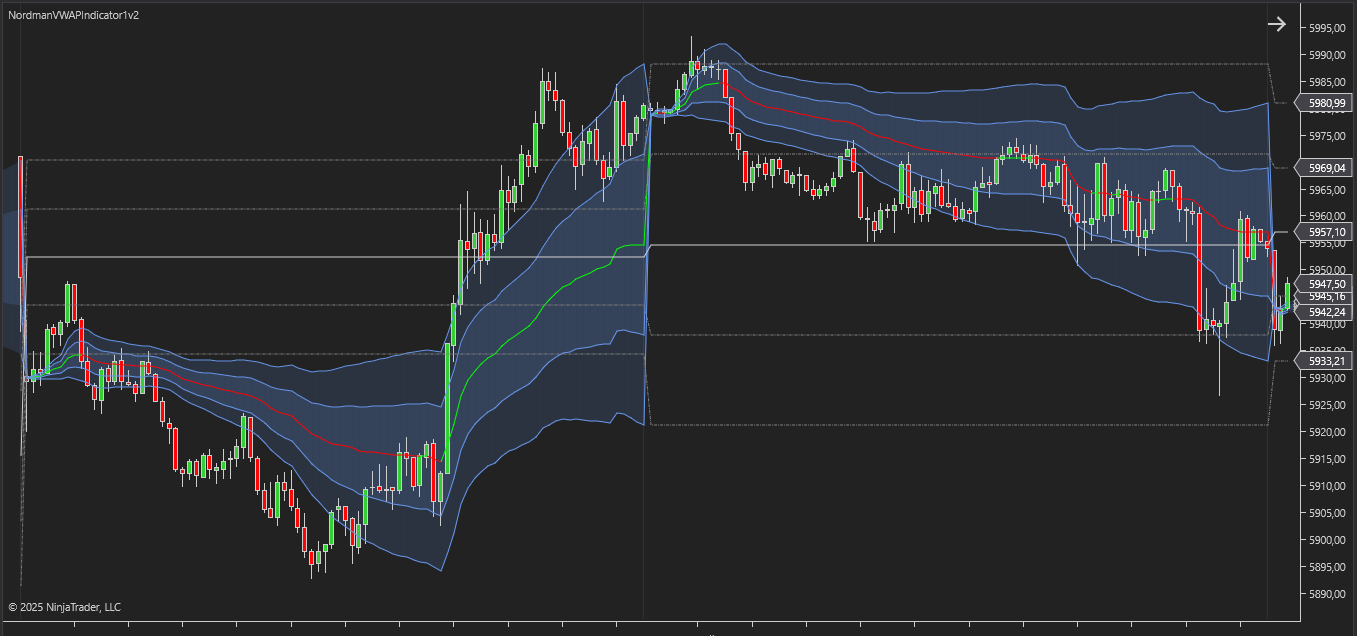
The indicator supports up to three customizable standard deviation bands, which can be configured using either coefficients or percentage-based thresholds. These bands show how far price moves away from the VWAP line and help highlight areas where price becomes extended relative to the session’s average level.
Previous Period Levels (Historical Overlays)
VWAP lines and deviation bands from previous periods can be displayed directly on the chart. This makes it possible to track how price interacts with VWAP zones from previous periods (session, day, week, and others) — an effective way to analyze price interaction with historical volume-weighted levels from prior periods.
Alerts and Event Notifications
The indicator provides customizable alerts for key events, such as price crossing the VWAP line or its deviation bands. These alerts help traders stay aware of important market movements in real time and can be integrated into automated trading systems.
Flexible Visualization Settings
Users have full control over how VWAP lines and deviation bands appear on the chart. The indicator allows detailed customization of color, thickness, style, and visibility, making it easy to adapt the visual display of its components to individual preferences and trading style.
The indicator has the following parameters:
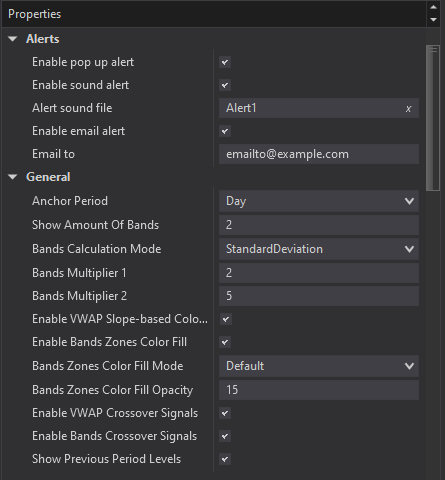
Alerts – Configure various types of alerts.
Anchor Period – defines the VWAP calculation period. Available options include Session, Week, Month, Quarter, Year, and a Custom Period. The custom setting allows traders to specify an exact start and end time, offering greater flexibility in analyzing specific market intervals.
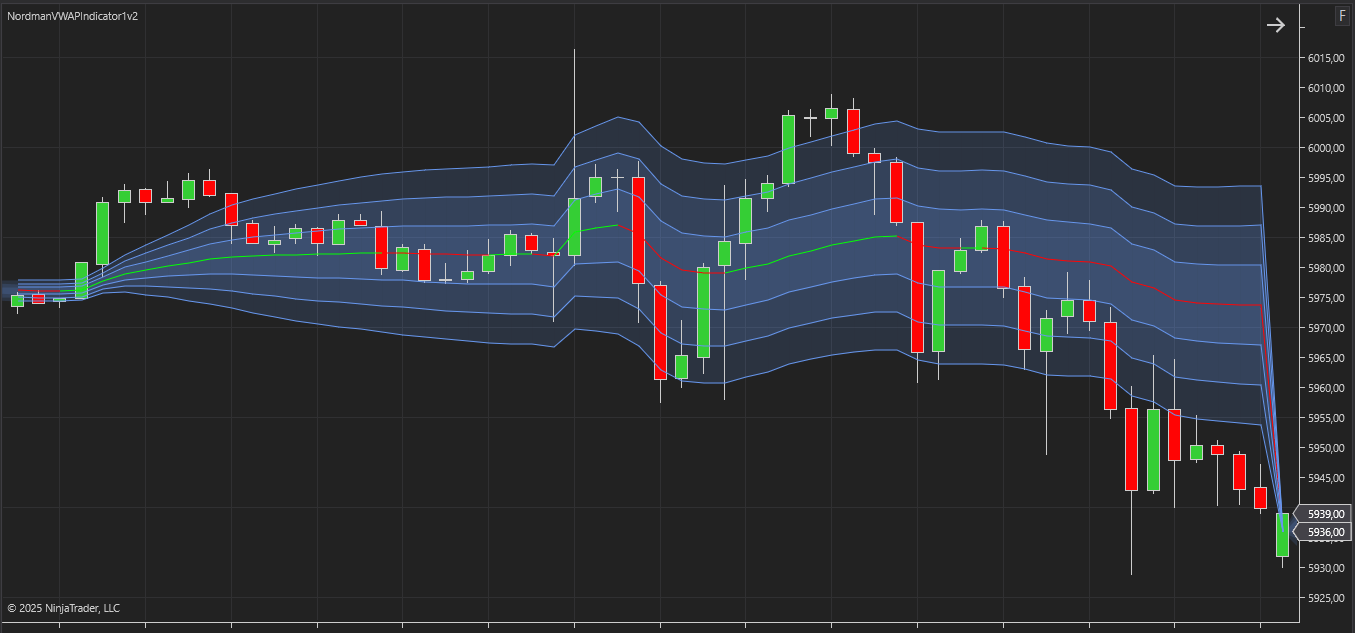
Show Amount of Bands – specifies how many standard deviation bands will be displayed around the VWAP line.
Bands Calculation Mode – determines the method used to calculate the deviation bands. Traders can either use standard deviation multipliers or specify these multipliers as percentages instead of traditional coefficient values.
Bands Multiplier 1 / 2 / 3 – these fields set the multiplier values for the deviation bands. For example, a value of “1” for Multiplier 1 plots a band one standard deviation away from the VWAP line.
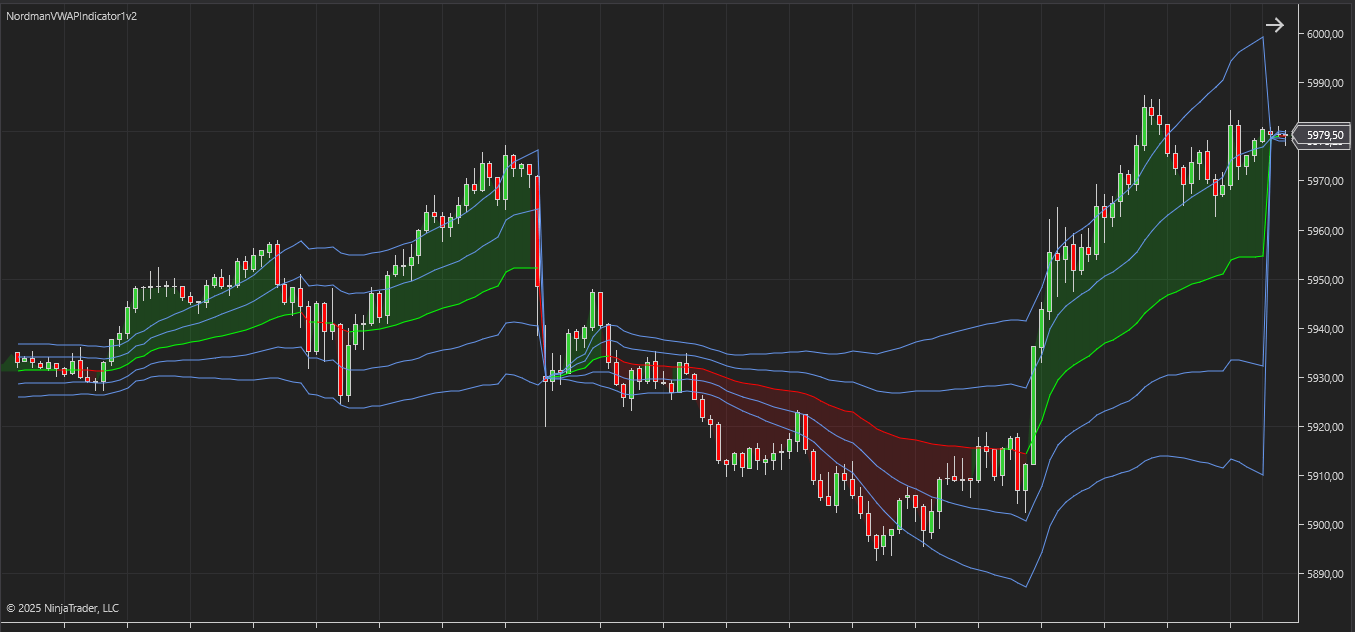
Enable VWAP Slope-based Coloring – activates dynamic color changes for the VWAP line based on its relationship to price action: green when the price is above VWAP, and red when below. This visual cue helps traders quickly observe how price is positioned relative to the VWAP line.
Enable Bands Zones Color Fill – Enables color filling for enhanced visual context. This feature supports two modes: Standard fill, which consistently colors the area between the VWAP line and its deviation bands, and Bullish/Bearish fill, which dynamically fills the area between the price and VWAP—green when the price is above VWAP and red when it is below—highlighting the current price-action phase relative to the VWAP line.
Enable VWAP Crossover Signals – activates visual markers when the price crosses the VWAP line.
Enable Bands Crossover Signals – turns on visual markers when the price crosses any of the deviation bands.
Show Previous Period Levels – displays the VWAP line and its deviation bands from previous periods.

We can customize this indicator to your needs — adding functions, modifying logic, or integrating it with other tools for your workflow.
We also convert indicators into Automated Trading Strategies with advanced functions (trailing stops, risk management, filters) tailored to your trading style strictly according to your specifications.
Request a free consultation to discuss the technical scope and timeline of your project.
We are committed to the ongoing development and refinement of our indicators. If you’ve spotted a bug, feel that something essential is missing, or have ideas that could make the indicator even better, just send us a message. Your feedback helps us improve and deliver tools that truly meet traders’ needs.
Nordman Algorithms is a trade name of Nordman Algorithms OÜ (Reg. No. 14435535), registered in Tallinn, Estonia.
Software Nature & User Responsibility — Nordman Algorithms provides algorithmic software tools for technical analysis. Nordman Algorithms is not a financial advisor and is not liable for any losses. All trades conducted based on the software’s output are executed at the user’s sole discretion and risk.
Visual Markers & Signal Disclosure — This software may display visual markers (such as arrows, dots, or alerts) when predefined mathematical conditions are met. These markers are provided for educational and analytical purposes only, must not be interpreted as financial guidance, and do not constitute a recommendation to buy, sell, or hold any financial instrument. Users must independently validate all visual cues within their own trading methodology.
No Financial Advice — Nordman Algorithms does not provide discretionary trading signals, investment advice, or managed signal services. Our software represents a mathematical visualization of historical and real-time data. The appearance of a visual marker does not guarantee a profitable trade or predict future market behavior.
Trading Risk Warning — Futures, Forex, and options trading involve significant risk. Risk capital is money that can be lost without jeopardizing financial security. Only risk capital should be used for trading. Past performance is not indicative of future results. View Full Risk Disclosure: https://www.nordman-algorithms.com/risk-disclosure/
ESMA Risk Warning — Financial instruments, especially those involving leverage such as CFDs and Forex, are complex and carry a high risk of rapid financial loss. Our software provides analytical outputs and visual markers based on predefined mathematical conditions and does not mitigate or reduce inherent market risks. You should carefully consider whether you understand how leveraged financial instruments work and whether you can afford the high risk of losing your capital.
CFTC Rule 4.41 — Hypothetical or simulated performance results have inherent limitations. Unlike actual performance records, simulated results do not represent real trading. Because trades have not actually been executed, these results may under- or over-compensate for the impact of market factors such as liquidity. No representation is being made that any account will achieve profits or losses similar to those shown.
Trademark Notice — NinjaTrader® is a registered trademark of NinjaTrader Group, LLC. No NinjaTrader company has any affiliation with the owner, developer, or provider of the products or services described herein, or any interest, ownership or otherwise, in any such product or service, or endorses, recommends or approves any such product or service.