The Triangle & Wedge Breakout Indicator automatically identifies five price formations — symmetrical triangle, ascending triangle, descending triangle, rising wedge, and falling wedge — using a fractal-based detection algorithm with a configurable MACD trend filter. Pattern detection is based on the geometric relationships between fractal highs and lows, with an additional directional filter to ensure detected formations align with the prevailing trend context.
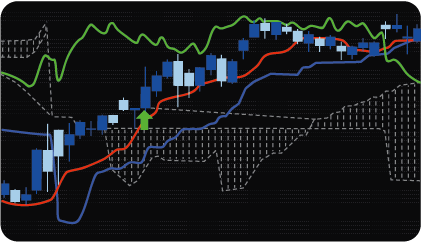
Pattern identification is built on two analytical layers: a fractal indicator for structural point identification, and a MACD filter for directional context.
Fractal indicator — identifies local price highs and lows by evaluating a defined number of bars to the left and right of each candidate peak or trough. The left-bar parameter controls how far back the fractal must be the dominant high or low — a larger value produces fewer but more structurally significant fractals. The right-bar parameter controls detection lag — a smaller value allows fractals to be identified closer to the current bar, at the cost of some additional noise.
Patterns are constructed by evaluating the geometric relationship between identified fractals:
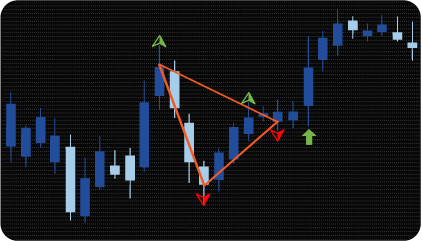
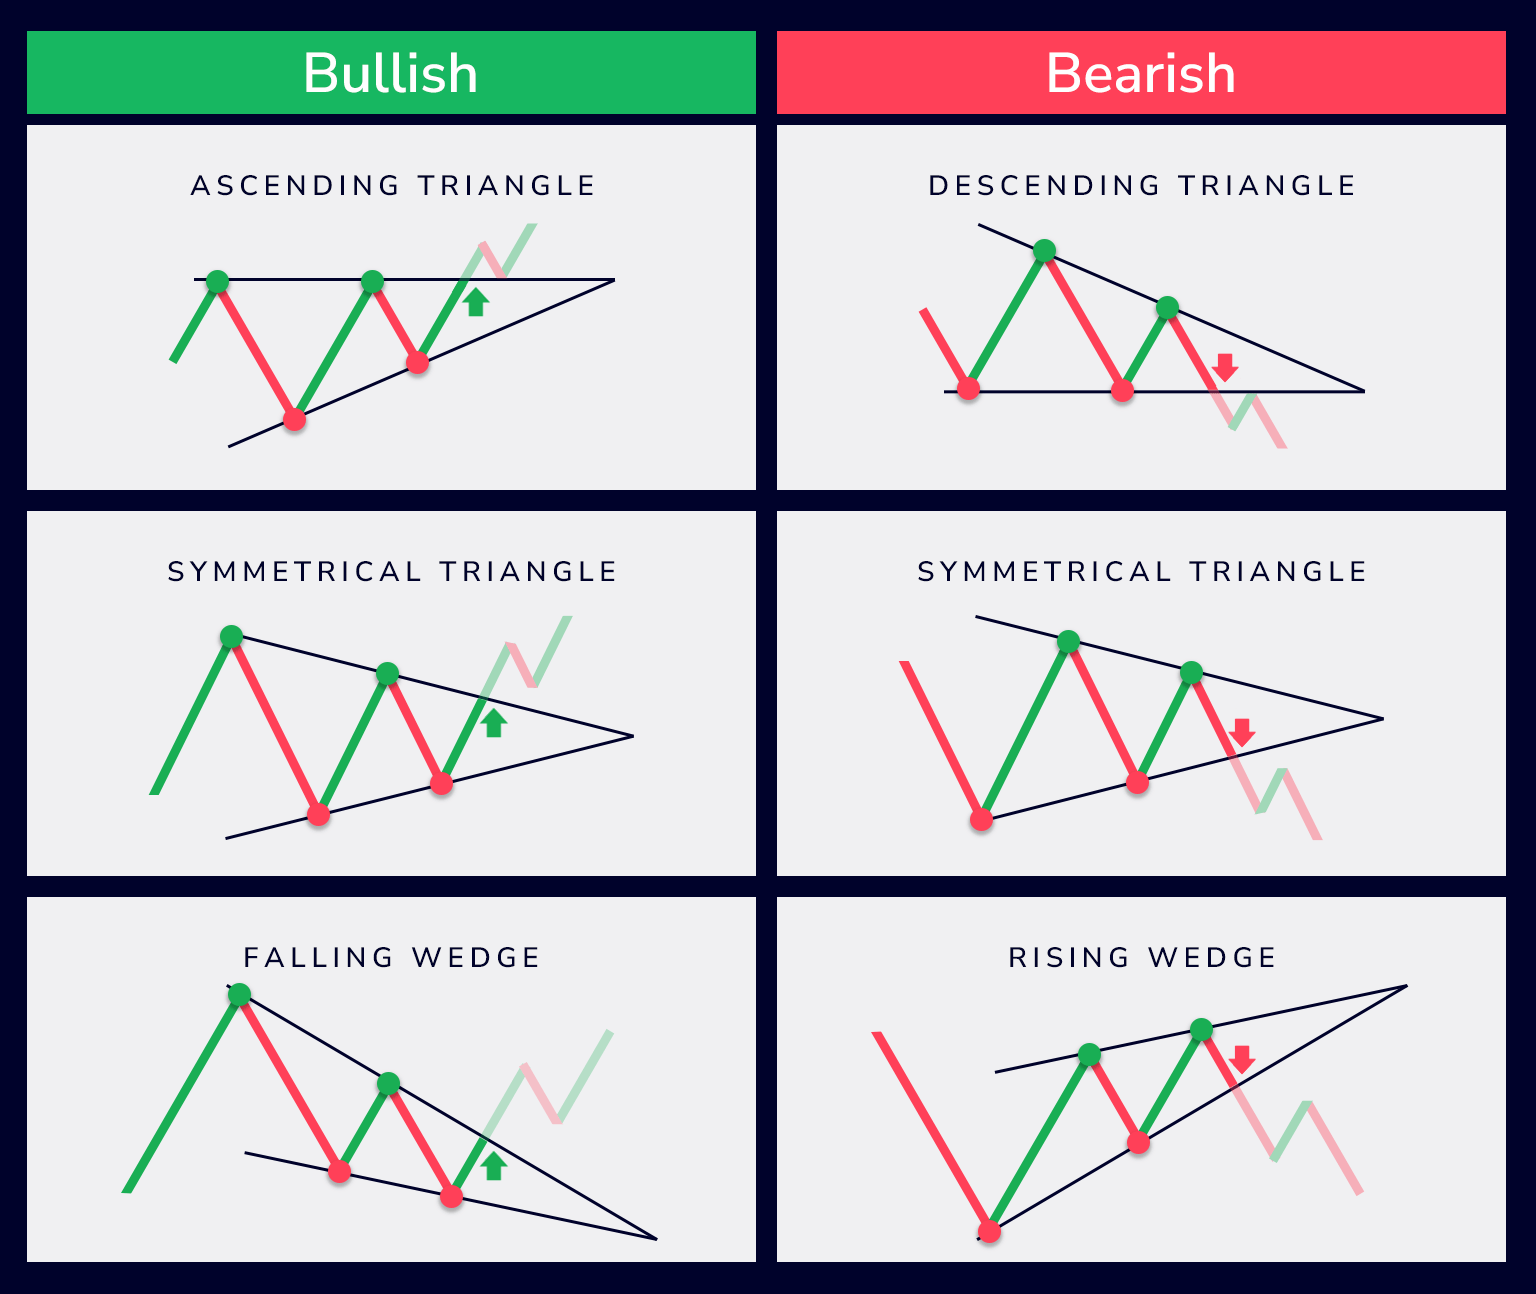
Symmetrical triangle — formed by two upper and two lower fractals where the upper boundary slopes downward and the lower boundary slopes upward, converging toward a point.
Ascending triangle — the upper boundary is approximately horizontal, the lower boundary slopes upward. A slight slope tolerance is configurable.
Descending triangle — the lower boundary is approximately horizontal, the upper boundary slopes downward.
Rising wedge — both boundaries slope upward, with the lower boundary steeper — causing the two lines to converge.
Falling wedge — both boundaries slope downward, with the upper boundary steeper — causing convergence in the opposite direction.
The directional context of each formation is determined by the sequence of alternating fractals: a bullish condition follows a lower fractal, a bearish condition follows an upper fractal.
MACD filter — applied as a secondary directional filter. When the MACD histogram is above the signal line, only bullish formations are registered. When the histogram is below the signal line, only bearish formations are registered. This ensures that detected formations are evaluated in the context of the prevailing trend direction as measured by MACD.
An additional prior movement check is also available — when enabled, it evaluates whether the price movement preceding the formation is consistent with the expected directional context of the pattern.
Each detected formation can be displayed in one of three graphical formats, selectable in the settings:
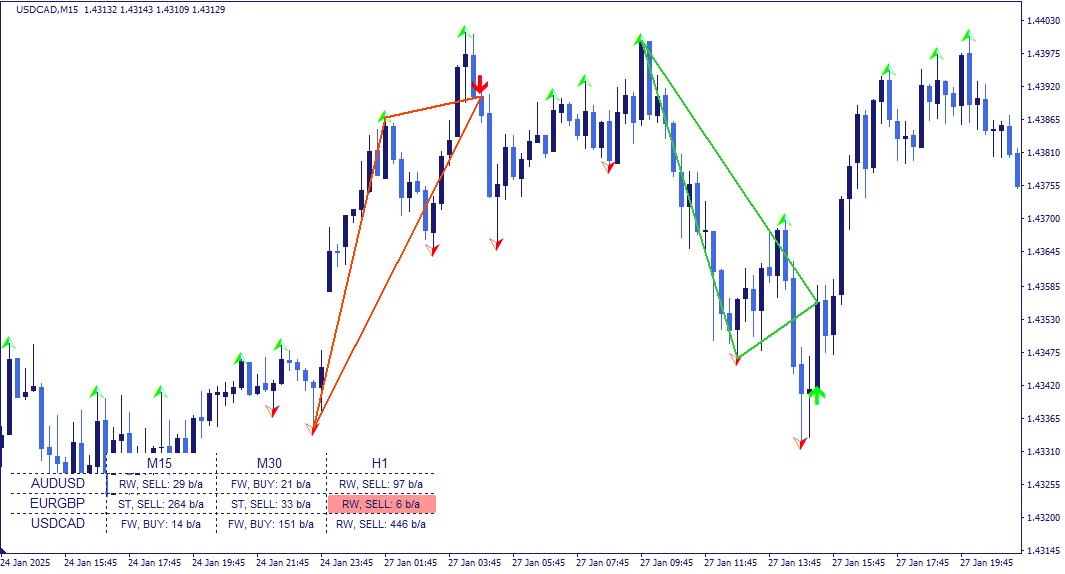
Trend lines — two lines drawn through the upper and lower fractal points that define the formation boundaries.
Triangle to last fractal — the formation is displayed as a filled triangle shape extending to the most recent fractal.
Triangle to signal bar — the formation is displayed as a filled triangle shape extending to the bar where the directional marker appears.
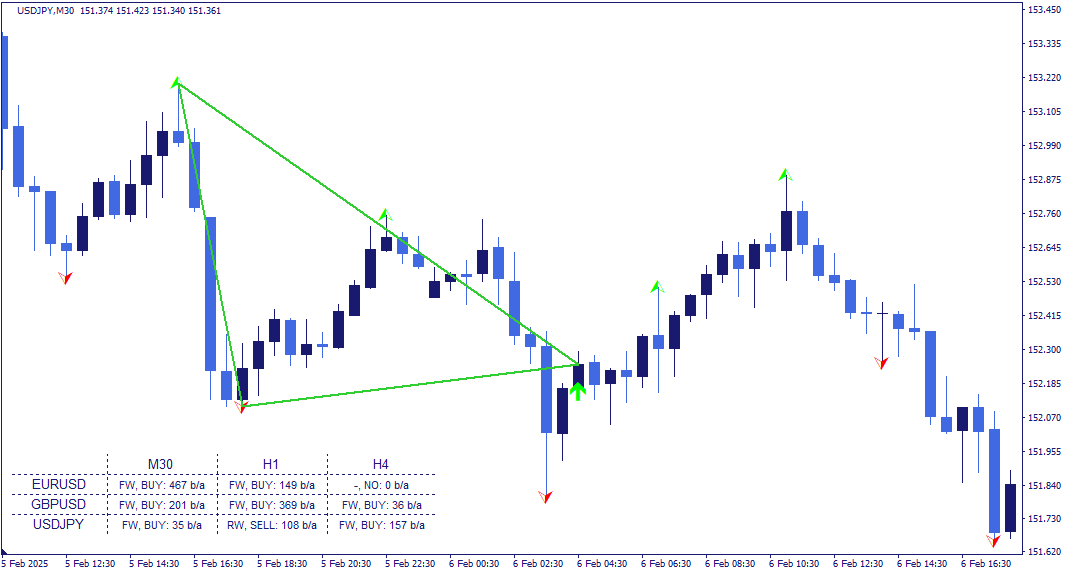
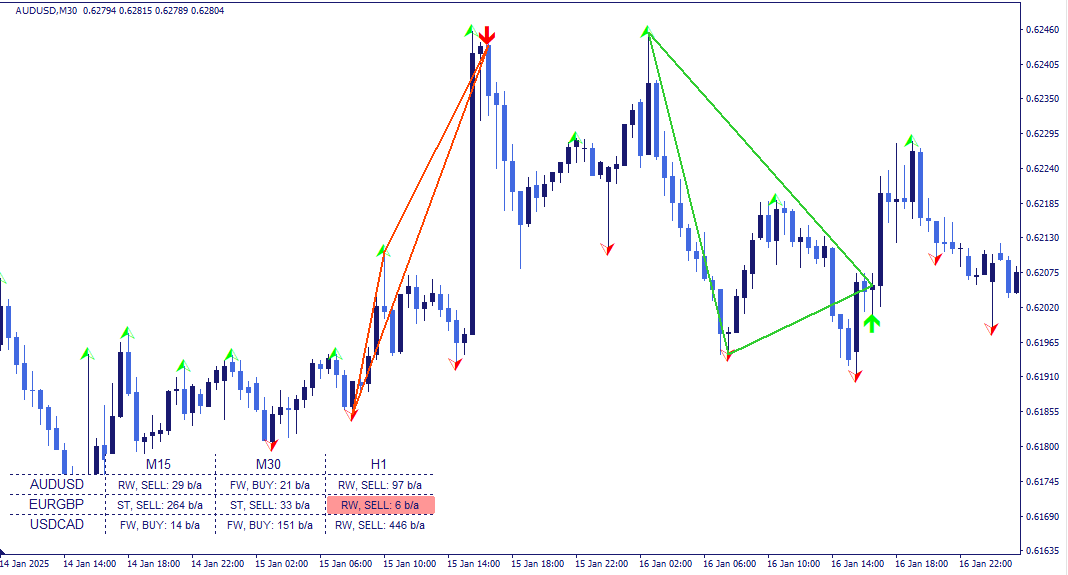
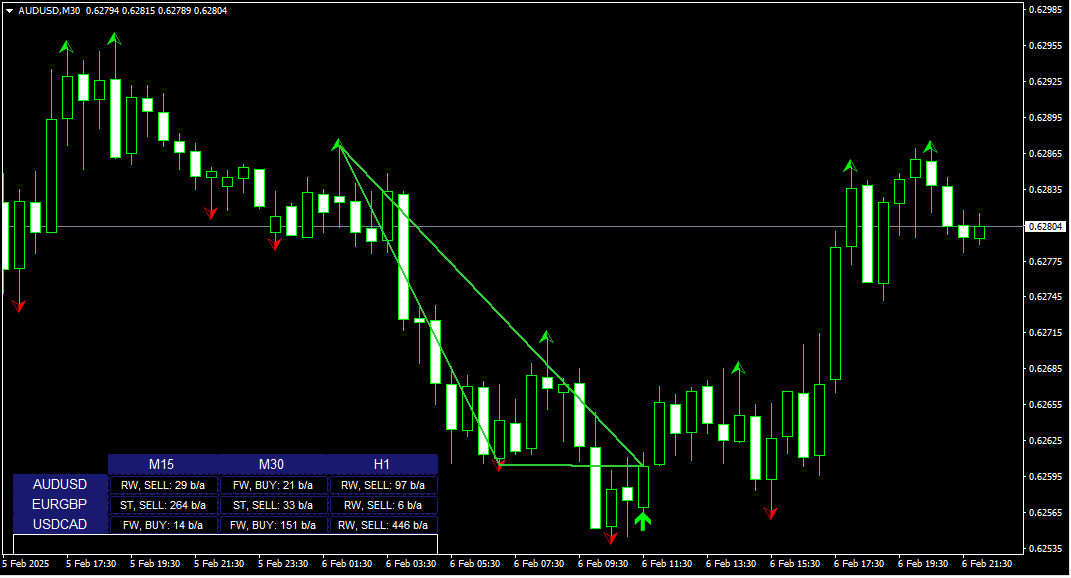
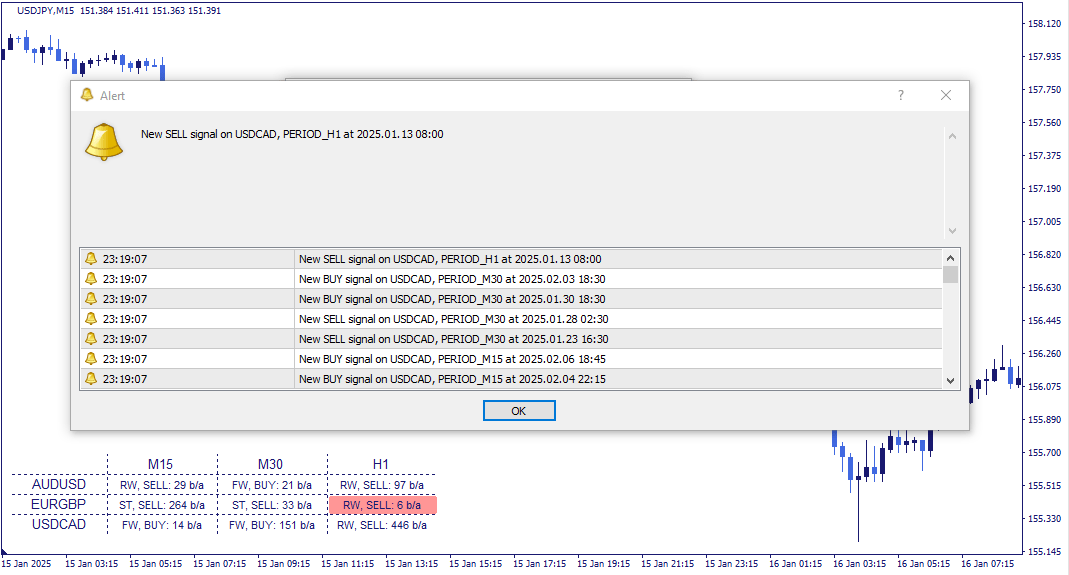
The dashboard displays the current detection status across all monitored assets and timeframes in a single structured view.
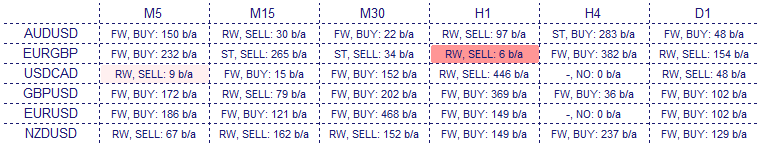
Each cell shows the abbreviated pattern name, the directional context of the registered condition — bullish or bearish — and the number of bars back at which it was registered. Clicking any cell updates the chart to the corresponding asset and timeframe directly.
The indicator has the following parameters:
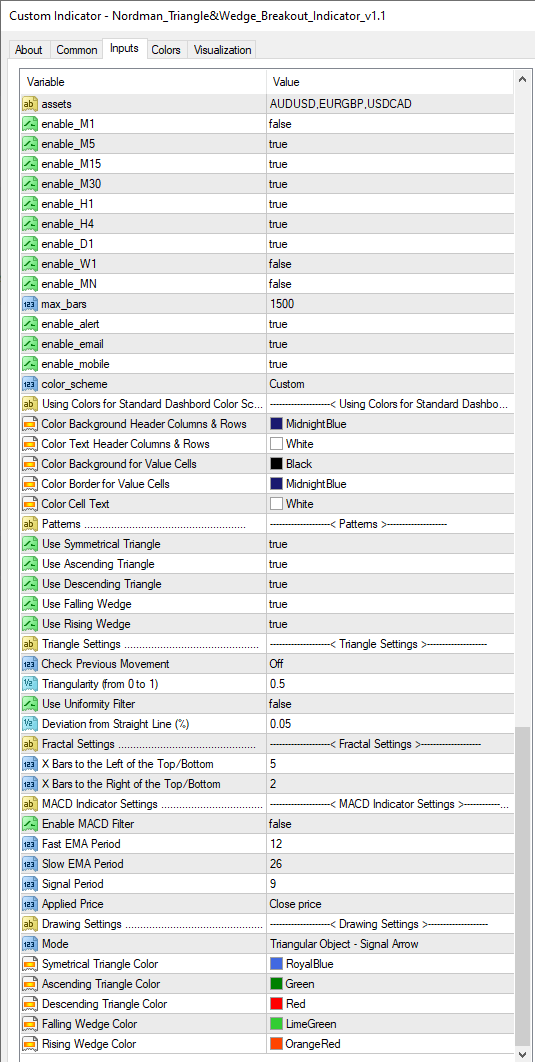
Assets — instruments to include in the scanner, entered as a comma-separated list.
Max_bars — limits how far back the scanner evaluates formations. Reducing this value improves calculation speed.
Enable alert / Enable email / Enable mobile — alert delivery: platform notifications, email, or mobile — each configurable independently.
Check Previous Movement — enables an additional check that the prior price movement is consistent with the pattern’s directional context before registering a condition.
Triangularity (0–1) — controls the shape tolerance of the pattern: 0 allows rectangular shapes, 1 requires a perfect triangle, intermediate values allow trapezoidal shapes.
Use Uniform Filter — enables an additional shape filter to refine pattern detection criteria.
Deviation from Straight Line — the acceptable slope tolerance for the horizontal edge in ascending and descending triangles.
X Bars to the left of Top/Bottom — controls how many bars to the left a fractal must be the dominant high or low.
X Bars to the right of Top/Bottom — controls detection lag on the right side of the fractal.
Triangular Object — selects the graphical display format: Trend Lines, Last Fractal, or Signal Arrow.
Indicator Limitations
Triangle and wedge detection is based on fractal geometry applied to historical price data. The indicator identifies formations that meet the defined structural and proportional criteria — it does not predict future price movement or guarantee that a detected formation will result in any particular price behavior. Pattern validity depends significantly on the fractal and MACD parameter settings — different configurations will produce different formation counts and detection sensitivity. All registered conditions should be evaluated within a broader analytical framework.

We can customize this indicator to your requirements by adding new features, modifying calculation logic, or combining multiple tools into a unified solution.
We also develop automated trading strategies (Expert Advisors) based on custom logic. The system can include configurable management modules such as dynamic risk parameters, multi-stage trailing stops, additional confirmation filters, and other custom functionality based on your specifications.
The final solution is delivered with full source code and post-delivery support. Contact us for a free consultation to discuss the scope and timeline of your project.
We are committed to the ongoing development and refinement of our indicators. If you’ve spotted a bug, feel that something essential is missing, or have ideas that could make the indicator even better, just send us a message. Your feedback helps us improve and deliver tools that truly meet traders’ needs.
Nordman Algorithms is a trade name of Nordman Algorithms OÜ (Reg. No. 14435535), registered in Tallinn, Estonia.
Software Nature & User Responsibility — Nordman Algorithms provides algorithmic software tools for technical analysis. Nordman Algorithms is not a financial advisor and is not liable for any losses. All trades conducted based on the software’s output are executed at the user’s sole discretion and risk.
Visual Markers & Signal Disclosure — This software may display visual markers (such as arrows, dots, or alerts) when predefined mathematical conditions are met. These markers are provided for educational and analytical purposes only, must not be interpreted as financial guidance, and do not constitute a recommendation to buy, sell, or hold any financial instrument. Users must independently validate all visual cues within their own trading methodology.
No Financial Advice — Nordman Algorithms does not provide discretionary trading signals, investment advice, or managed signal services. Our software represents a mathematical visualization of historical and real-time data. The appearance of a visual marker does not guarantee a profitable trade or predict future market behavior.
Trading Risk Warning — Futures, Forex, and options trading involve significant risk. Risk capital is money that can be lost without jeopardizing financial security. Only risk capital should be used for trading. Past performance is not indicative of future results. View Full Risk Disclosure: https://www.nordman-algorithms.com/risk-disclosure/
ESMA Risk Warning — Financial instruments, especially those involving leverage such as CFDs and Forex, are complex and carry a high risk of rapid financial loss. Our software provides analytical outputs and visual markers based on predefined mathematical conditions and does not mitigate or reduce inherent market risks. You should carefully consider whether you understand how leveraged financial instruments work and whether you can afford the high risk of losing your capital.
CFTC Rule 4.41 — Hypothetical or simulated performance results have inherent limitations. Unlike actual performance records, simulated results do not represent real trading. Because trades have not actually been executed, these results may under- or over-compensate for the impact of market factors such as liquidity. No representation is being made that any account will achieve profits or losses similar to those shown.