The Inside & Outside Bar Indicator automatically identifies two specific price bar patterns — Inside Bar and Outside Bar — and displays them across all monitored assets and timeframes through a structured dashboard.
Inside Bar is a bar whose high-low range falls completely within the high-low range of the preceding bar. This means the current bar represents a narrower price range than the one before it — a structural condition typically associated with consolidation or reduced directional pressure following a prior move.
Outside Bar (Engulfing Bar) is a bar whose high-low range completely contains the high-low range of the preceding bar. The current bar extends beyond both the high and low of the prior bar — a structural condition typically associated with a directional expansion following a period of consolidation.
Both patterns are most reliably identified on timeframes from M30 and above. On lower timeframes, short-term price noise increases the frequency of pattern formation without the structural context that gives these patterns analytical weight.
The indicator registers a condition when it detects a qualifying Inside or Outside Bar. The directional context of the registered condition is determined by the character of the pattern bar itself — not by a subsequent price move.
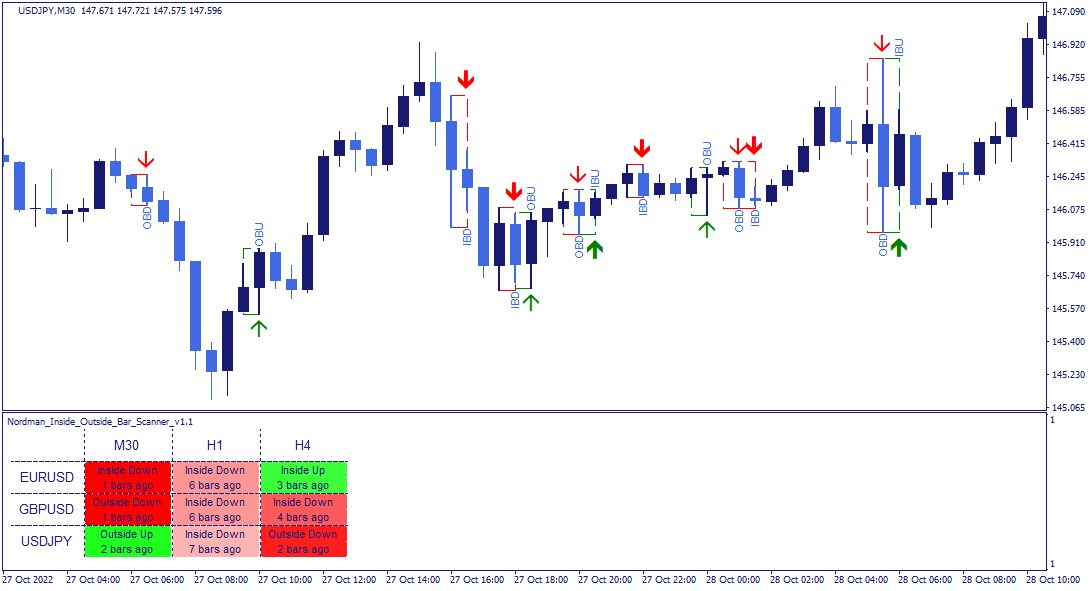
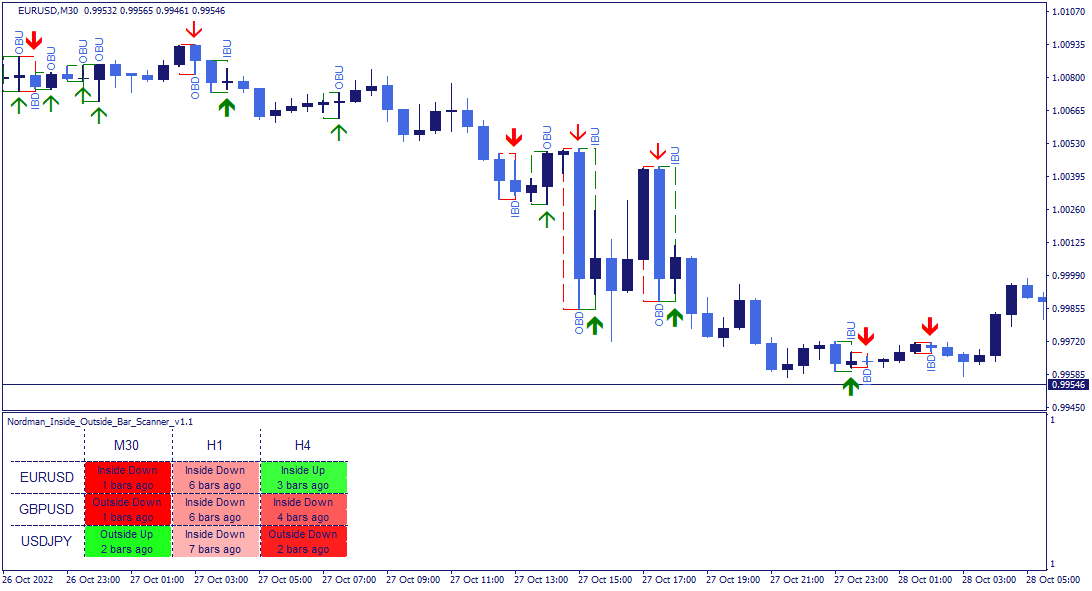
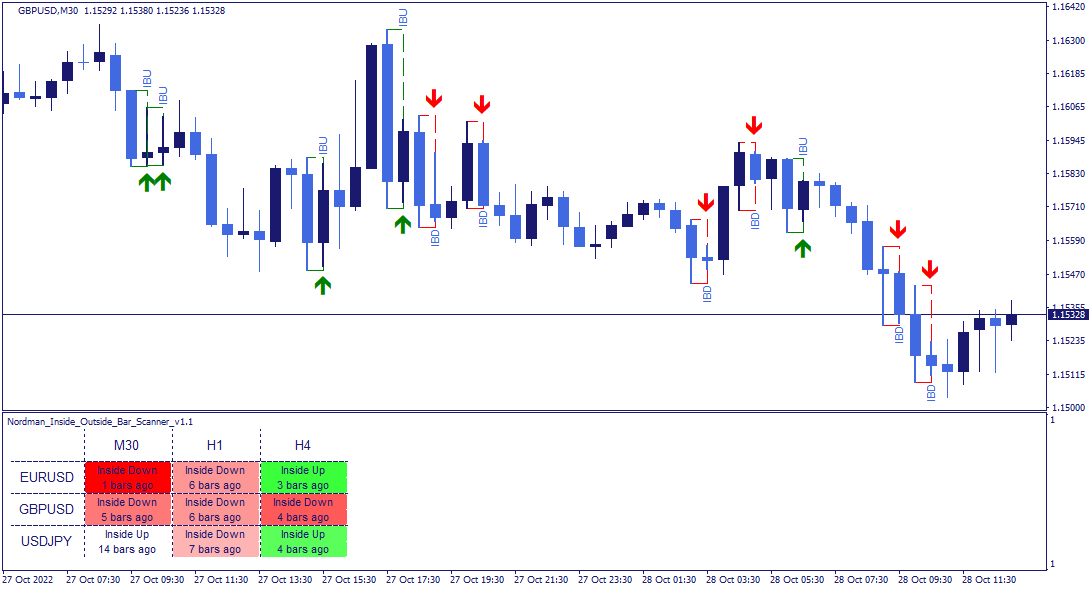
When the pattern bar is bullish (close above open), a bullish condition is registered — labeled IBU (Inside Bar Up) or OBU (Outside Bar Up) depending on pattern type.
When the pattern bar is bearish (close below open), a bearish condition is registered — labeled IBD (Inside Bar Down) or OBD (Outside Bar Down).
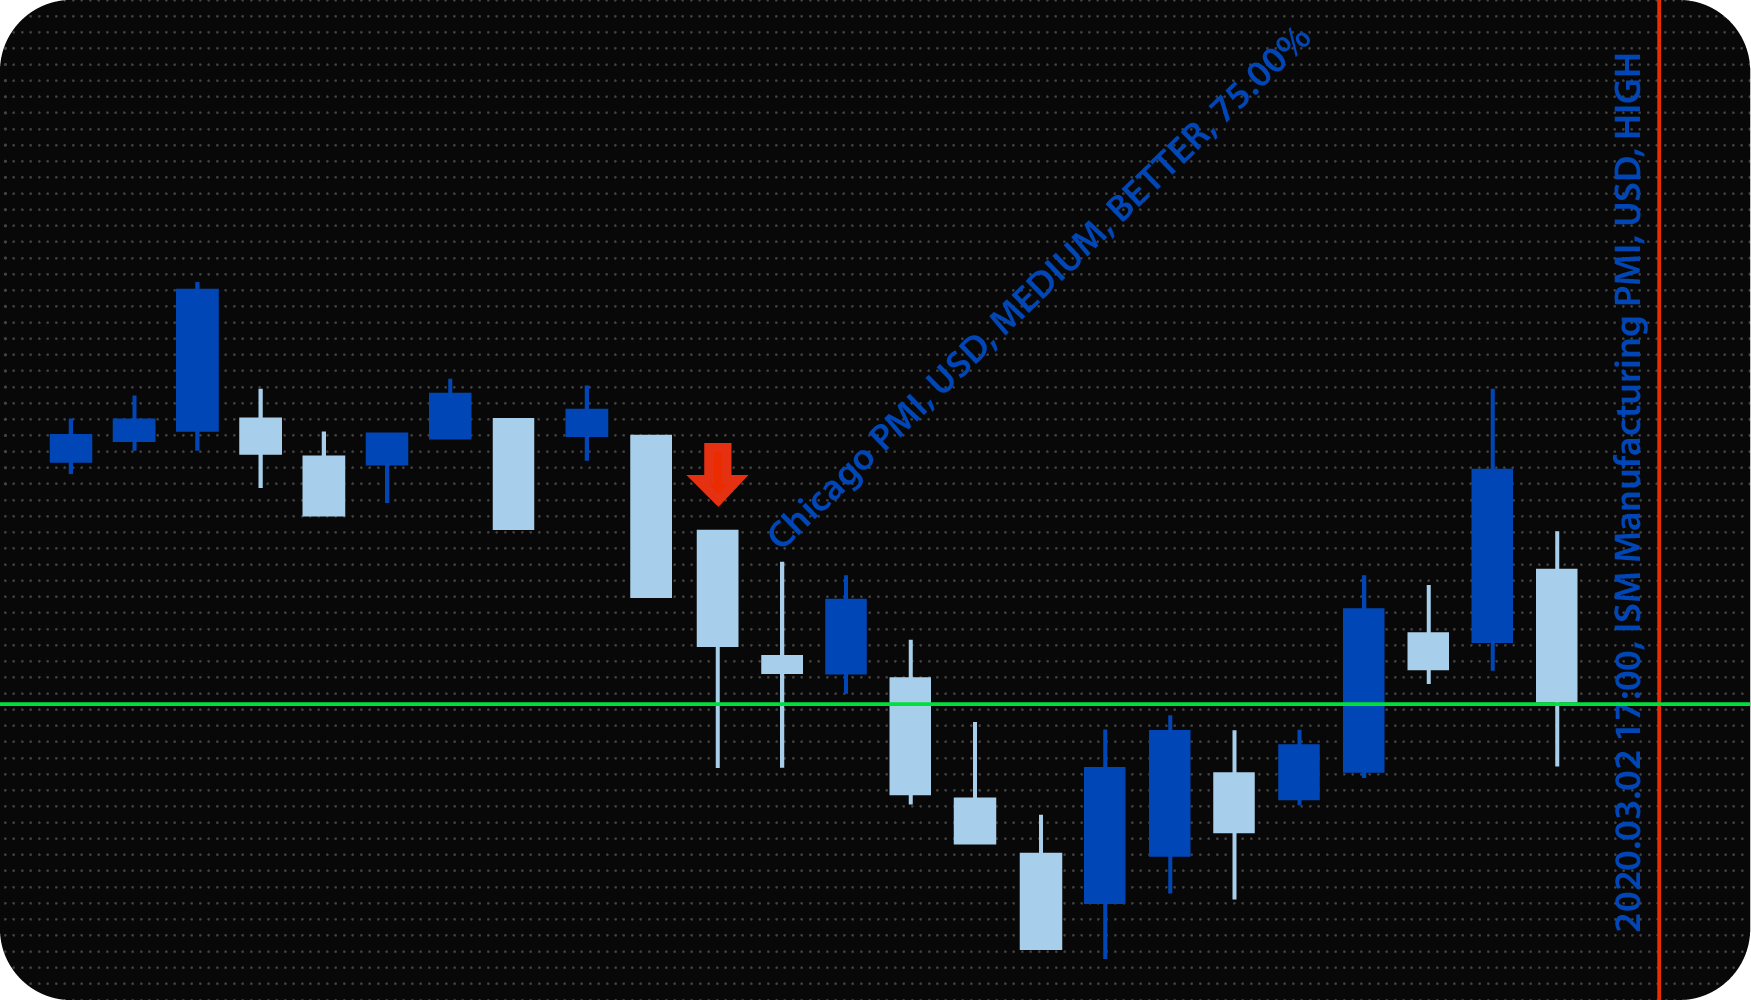
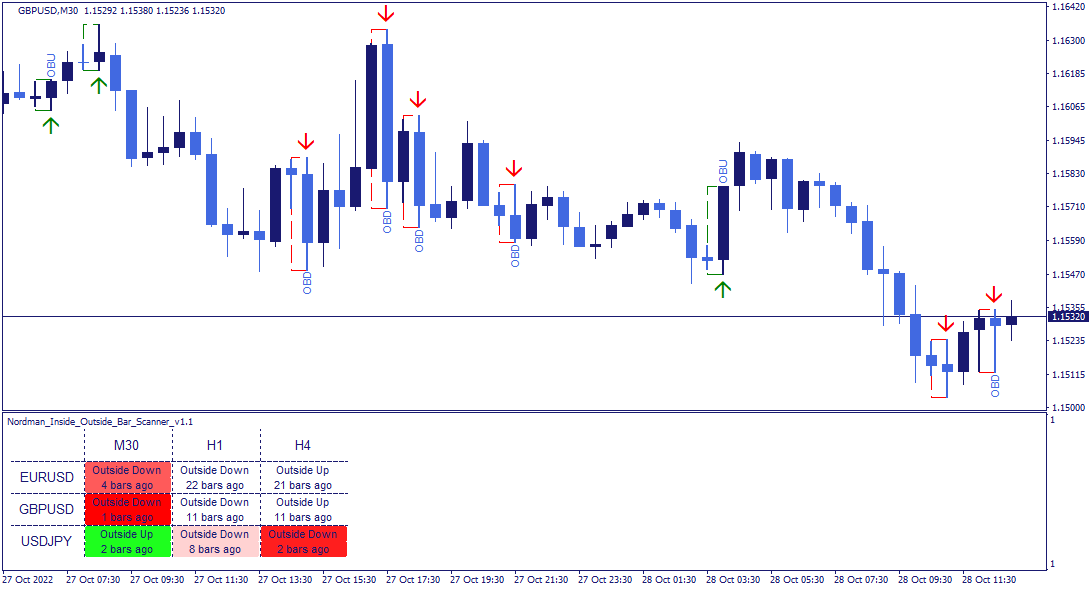
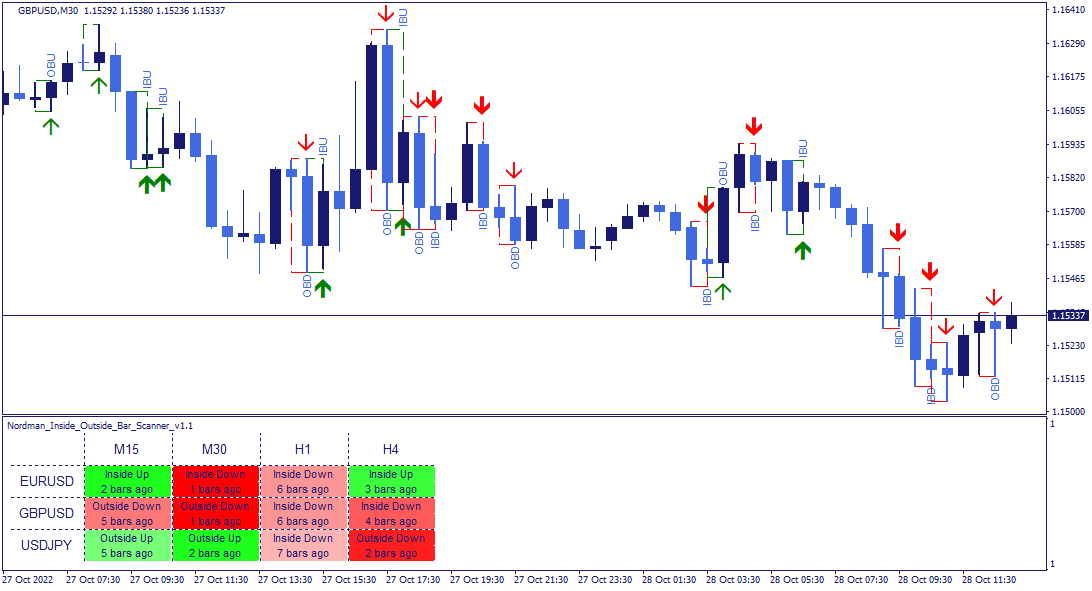
Each registered condition is displayed on the chart with three visual elements: a directional marker arrow, a vertical label showing the pattern abbreviation, and a dotted rectangle highlighting the bars that form the pattern.
Arrow thickness indicates pattern type — thin arrows correspond to Outside Bar conditions, thick arrows correspond to Inside Bar conditions. This allows both pattern types to be distinguished at a glance when both are enabled simultaneously.
Timeframe context: Inside and Outside Bar patterns reflect structural relationships between adjacent bars. On timeframes below M30, the frequency of these formations increases significantly due to short-term price noise — reducing the analytical context of each individual pattern. The indicator remains functional on all timeframes, but the structural significance of detected patterns is generally considered higher on M30 and above.
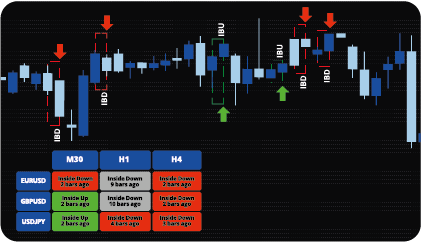
The dashboard displays the current detection status across all monitored assets and timeframes in a single structured view.
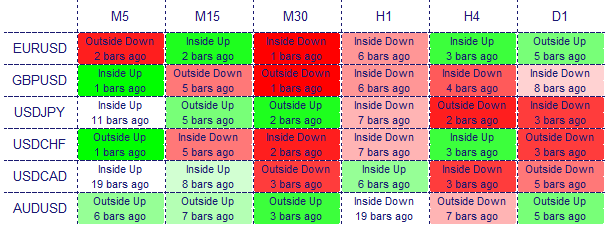
Each cell shows the pattern type detected (Inside or Outside Bar), the directional context of the registered condition (bullish or bearish), and the number of bars back at which the pattern was detected. Green cells indicate a bullish condition, red cells a bearish one. Color saturation decreases as the condition becomes less recent. Clicking any cell updates the chart to the corresponding asset and timeframe directly.
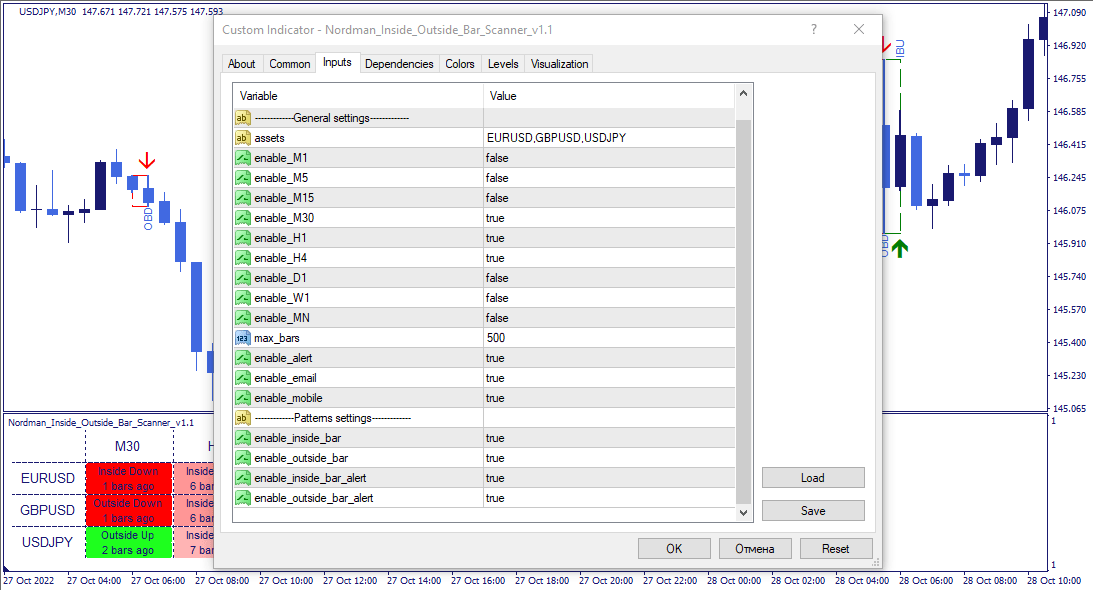
The indicator has the following parameters:
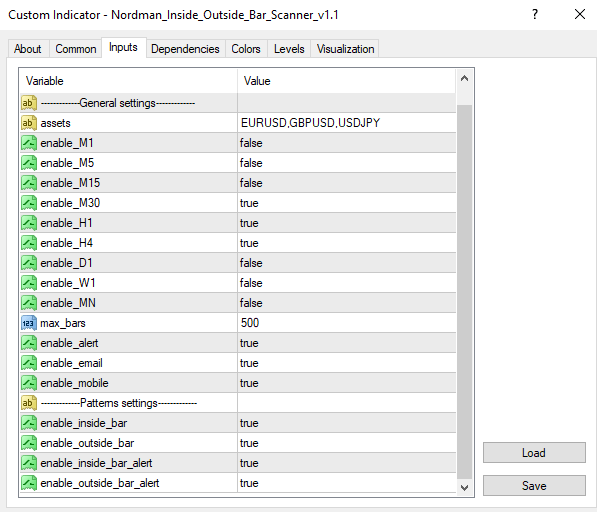
Assets — instruments to include in the scanner.
Enable_M1–MN — include or exclude individual timeframes from the scanner scope.
Max_bars — limits how far back the scanner evaluates conditions. Reducing this value improves calculation speed.
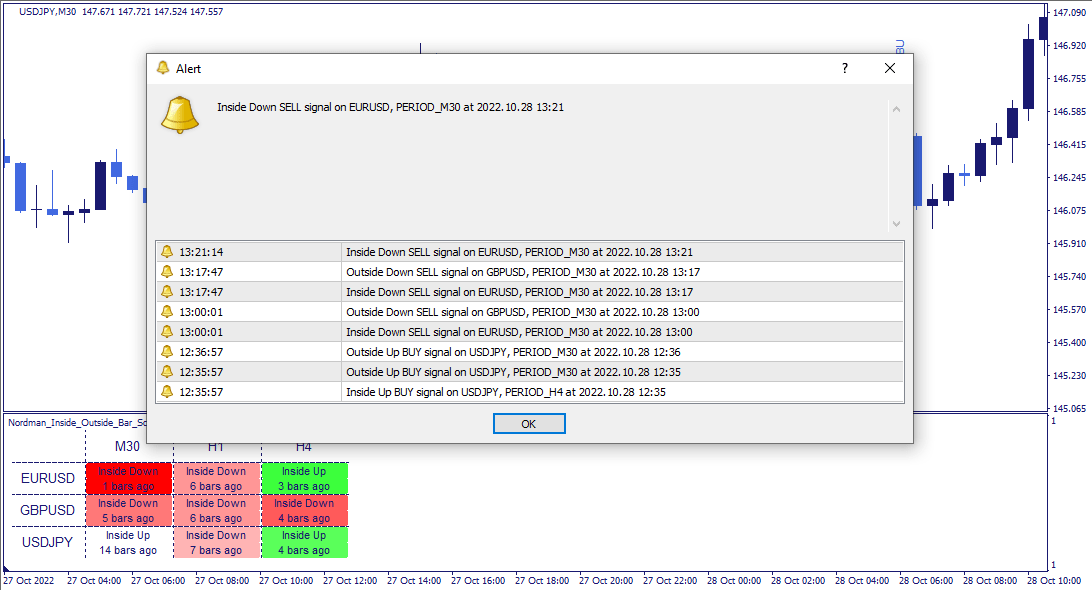
Enable alert / Enable email / Enable mobile — alert delivery: platform notifications, email, or mobile — each configurable independently.
Enable_inside_bar — enables or disables Inside Bar detection.
Enable_outside_bar — enables or disables Outside Bar detection.
Enable_inside_bar_alert — enables or disables alerts specifically for Inside Bar conditions.
Enable_outside_bar_alert — enables or disables alerts specifically for Outside Bar conditions.
Indicator Limitations
Inside Bar and Outside Bar patterns are identified based on the structural relationship between adjacent price bars. The indicator detects formations that meet the defined geometric criteria — it does not predict the direction or magnitude of subsequent price movement. Pattern frequency increases on lower timeframes due to noise, reducing the structural context of individual detections. All registered conditions should be evaluated within a broader analytical framework that considers overall market structure and context.

We can customize this indicator to your requirements by adding new features, modifying calculation logic, or combining multiple tools into a unified solution.
We also develop automated trading strategies (Expert Advisors) based on custom logic. The system can include configurable management modules such as dynamic risk parameters, multi-stage trailing stops, additional confirmation filters, and other custom functionality based on your specifications.
The final solution is delivered with full source code and post-delivery support. Contact us for a free consultation to discuss the scope and timeline of your project.
We are committed to the ongoing development and refinement of our indicators. If you’ve spotted a bug, feel that something essential is missing, or have ideas that could make the indicator even better, just send us a message. Your feedback helps us improve and deliver tools that truly meet traders’ needs.
Nordman Algorithms is a trade name of Nordman Algorithms OÜ (Reg. No. 14435535), registered in Tallinn, Estonia.
Software Nature & User Responsibility — Nordman Algorithms provides algorithmic software tools for technical analysis. Nordman Algorithms is not a financial advisor and is not liable for any losses. All trades conducted based on the software’s output are executed at the user’s sole discretion and risk.
Visual Markers & Signal Disclosure — This software may display visual markers (such as arrows, dots, or alerts) when predefined mathematical conditions are met. These markers are provided for educational and analytical purposes only, must not be interpreted as financial guidance, and do not constitute a recommendation to buy, sell, or hold any financial instrument. Users must independently validate all visual cues within their own trading methodology.
No Financial Advice — Nordman Algorithms does not provide discretionary trading signals, investment advice, or managed signal services. Our software represents a mathematical visualization of historical and real-time data. The appearance of a visual marker does not guarantee a profitable trade or predict future market behavior.
Trading Risk Warning — Futures, Forex, and options trading involve significant risk. Risk capital is money that can be lost without jeopardizing financial security. Only risk capital should be used for trading. Past performance is not indicative of future results. View Full Risk Disclosure: https://www.nordman-algorithms.com/risk-disclosure/
ESMA Risk Warning — Financial instruments, especially those involving leverage such as CFDs and Forex, are complex and carry a high risk of rapid financial loss. Our software provides analytical outputs and visual markers based on predefined mathematical conditions and does not mitigate or reduce inherent market risks. You should carefully consider whether you understand how leveraged financial instruments work and whether you can afford the high risk of losing your capital.
CFTC Rule 4.41 — Hypothetical or simulated performance results have inherent limitations. Unlike actual performance records, simulated results do not represent real trading. Because trades have not actually been executed, these results may under- or over-compensate for the impact of market factors such as liquidity. No representation is being made that any account will achieve profits or losses similar to those shown.