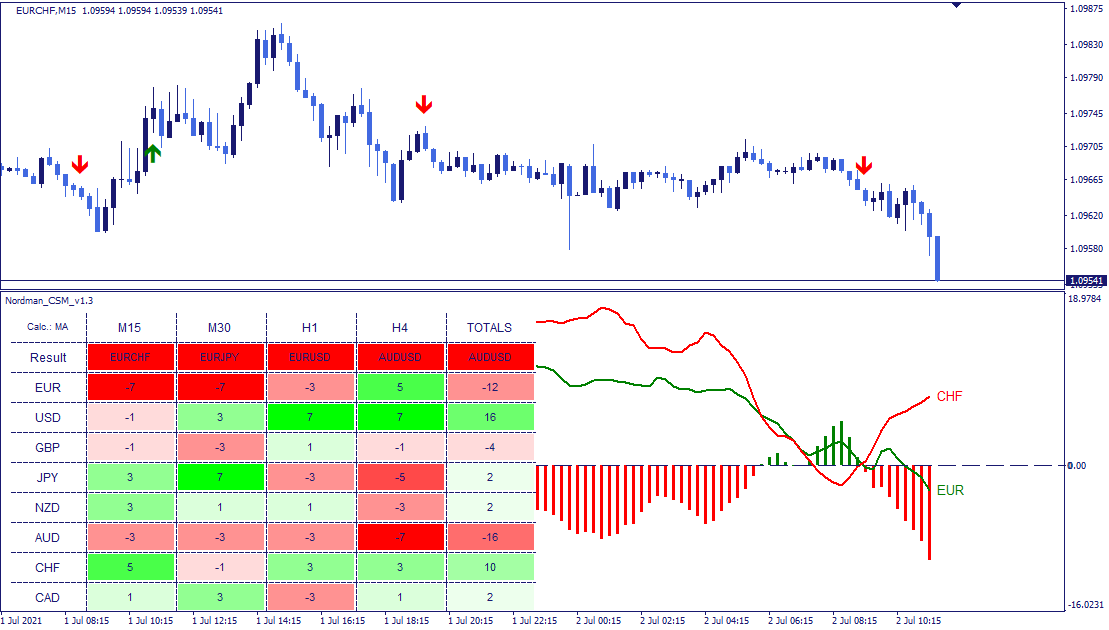
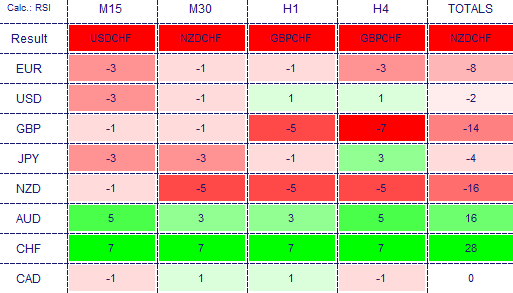
The Currency Strength Meter Indicator evaluates the relative strength of eight major currencies by analyzing 28 currency pairs across all available timeframes. The calculation is based on one of three selectable oscillators — MA, MACD, or RSI — applied consistently across all pairs and timeframes. For each timeframe, each currency receives a positive or negative value depending on whether it shows strength or weakness relative to the others. The TOTALS column aggregates these values across all timeframes, producing a single composite score per currency.
The higher the TOTALS value, the stronger the currency’s current reading across the analyzed timeframes. A negative TOTALS value indicates relative weakness.
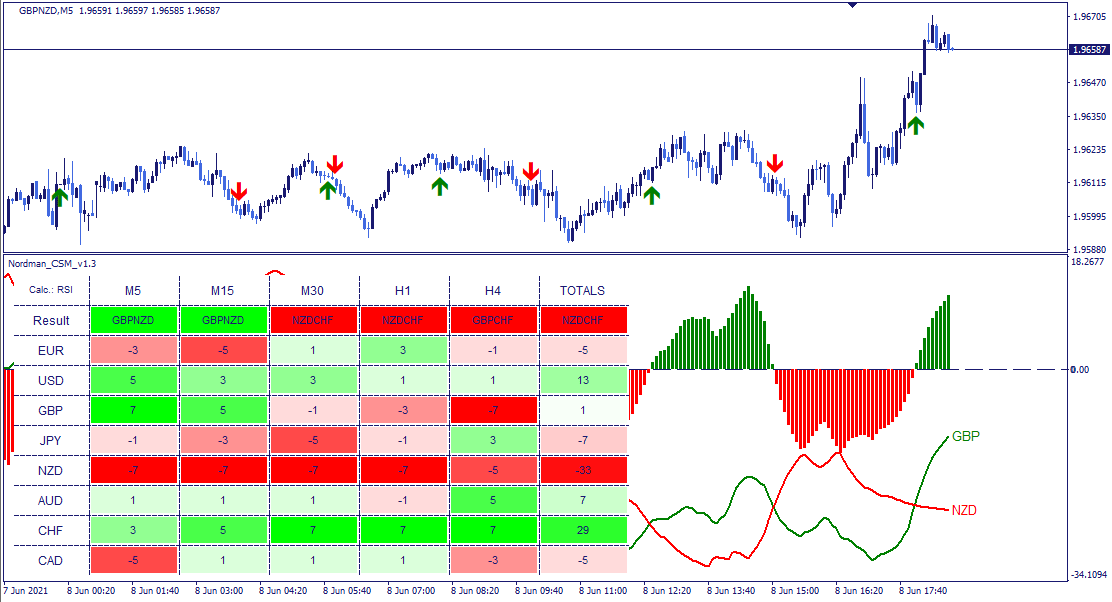
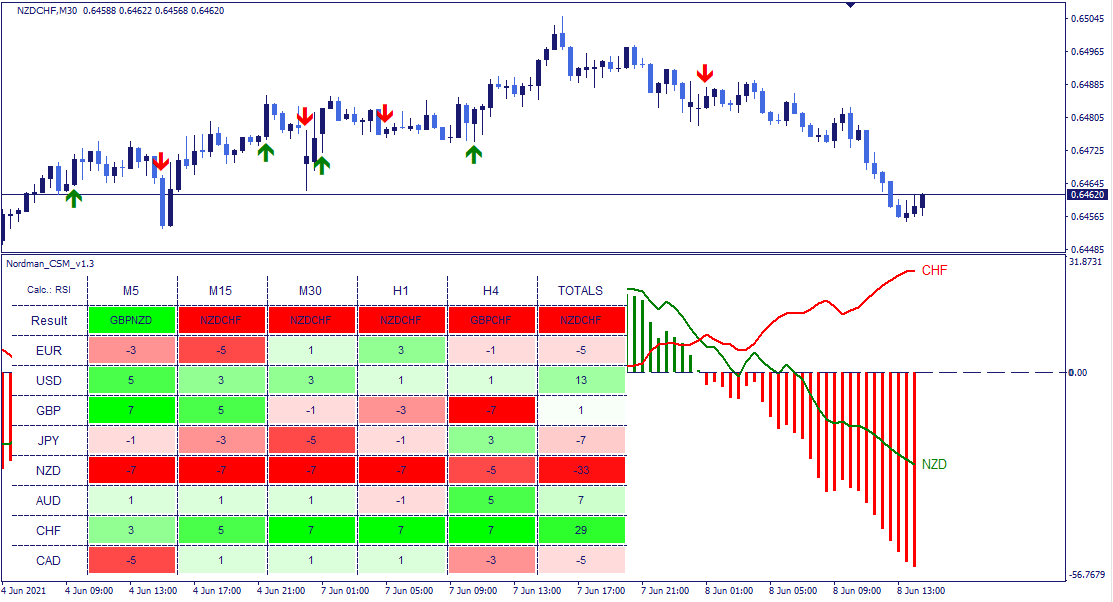
In the example above, CHF shows the highest TOTALS score at +29, indicating the strongest relative reading across timeframes. NZD shows the lowest at -33, indicating the weakest.
The indicator also includes configurable alerts and dashboard-level notifications — triggered when currency strength conditions meet defined thresholds.
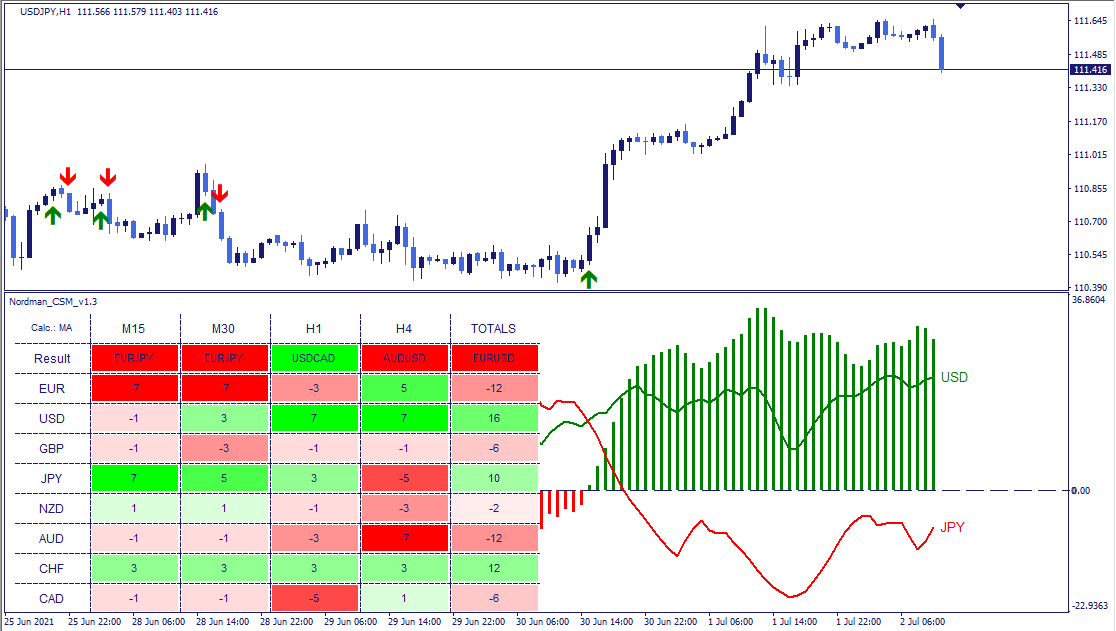
The indicator evaluates relative currency strength using the selected oscillator — MA, MACD, or RSI. Each oscillator reflects a different aspect of price behavior, and the choice of oscillator affects how strength is calculated and displayed.
When RSI is selected, the indicator plots strength lines for each currency. A bullish condition is registered when a stronger currency’s line crosses above a weaker currency’s line — confirmed by the histogram crossing above zero and changing from red to green. A bearish condition is registered when the reverse occurs — the histogram crosses below zero and the stronger line moves below the weaker one.
The registered condition remains active until the opposite crossover occurs — either the histogram returning below zero or the previously stronger line crossing back below the weaker one.
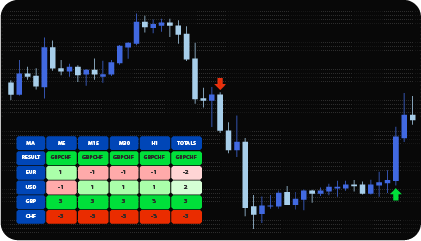
Timeframe context matters when reading the indicator. The strength readings are specific to each timeframe — a condition registered on M5 reflects the strength relationship on that timeframe only. Analysts typically align the observed strength relationship with the timeframe they are monitoring. In the example above, on M5 and M15, GBP shows strength relative to NZD. On M30, NZD shows weakness relative to CHF — reflecting a different strength relationship on a different timeframe.
The dashboard provides a structured overview of relative currency strength across all monitored timeframes for all eight major currencies simultaneously.
Strength is calculated by scoring each currency against the others on each timeframe: one point is added when a currency shows relative strength on a given timeframe, and one point is deducted when it shows relative weakness. These scores are based on the selected oscillator — MA, MACD, or RSI.
The Results row shows the score for each individual timeframe. The Totals row shows the aggregate score across all monitored timeframes.
If all cells for a currency are green, it is showing relative strength across all timeframes simultaneously. If all cells are red, it is showing relative weakness across all timeframes. Mixed colors indicate strength on some timeframes and weakness on others.
In the example above, CHF shows the highest aggregate score — one point on each timeframe — while NZD shows the lowest. This reflects the strength relationship registered by the indicator at that moment. Values update continuously as market conditions change.
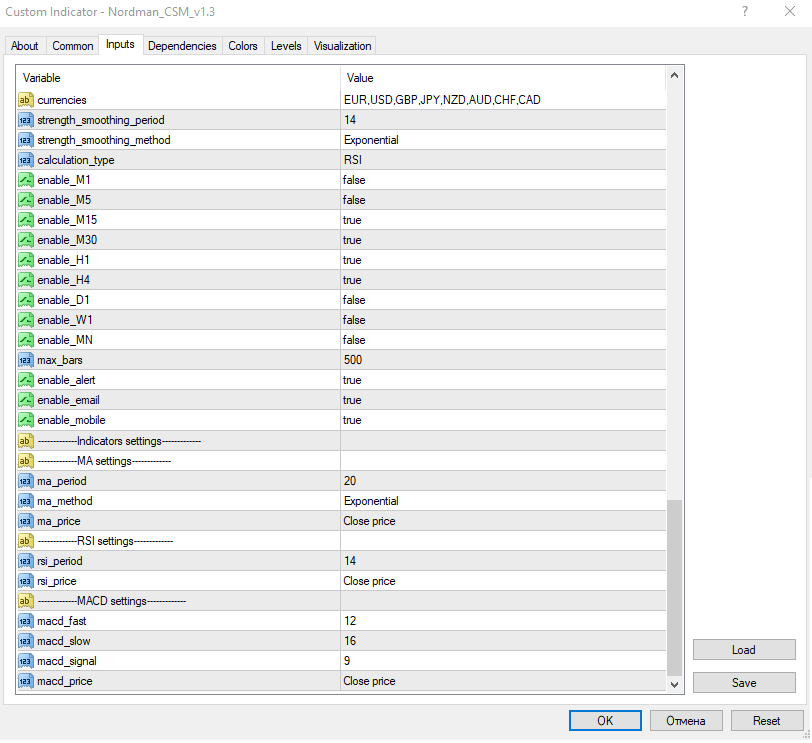
The indicator has the following parameters:
Currencies — select the currencies to include in the calculation.
Strength_smoothing_period — the number of periods used in the strength calculation.
Strength_smoothing_method — the smoothing method applied to the calculation.
Calculation_type — selects the oscillator used as the calculation base: MA, RSI, or MACD.
Enable_M1–MN — includes or excludes individual timeframes from the calculation scope.
Max_bars — limits the number of bars included in calculations. Reducing this value improves calculation speed when full historical depth is not required.
Enable alert / Enable email / Enable mobile — configures alert delivery: platform notifications, email, or mobile — each configurable independently.
Indicator settings — individual parameter configuration for the MA, RSI, and MACD oscillators used in the strength calculation.
Indicator Limitations
Currency strength readings are derived from the selected oscillator’s behavior across historical price data. The scores reflect relative strength relationships between currencies at the time of calculation — they do not predict future price movement and do not guarantee that a currency pair will move in any particular direction. All readings should be evaluated within a broader analytical framework that considers current market structure and conditions.

We can customize this indicator to your requirements by adding new features, modifying calculation logic, or combining multiple tools into a unified solution.
We also develop automated trading strategies (Expert Advisors) based on custom logic. The system can include configurable management modules such as dynamic risk parameters, multi-stage trailing stops, additional confirmation filters, and other custom functionality based on your specifications.
The final solution is delivered with full source code and post-delivery support. Contact us for a free consultation to discuss the scope and timeline of your project.
We are committed to the ongoing development and refinement of our indicators. If you’ve spotted a bug, feel that something essential is missing, or have ideas that could make the indicator even better, just send us a message. Your feedback helps us improve and deliver tools that truly meet traders’ needs.
Nordman Algorithms is a trade name of Nordman Algorithms OÜ (Reg. No. 14435535), registered in Tallinn, Estonia.
Software Nature & User Responsibility — Nordman Algorithms provides algorithmic software tools for technical analysis. Nordman Algorithms is not a financial advisor and is not liable for any losses. All trades conducted based on the software’s output are executed at the user’s sole discretion and risk.
Visual Markers & Signal Disclosure — This software may display visual markers (such as arrows, dots, or alerts) when predefined mathematical conditions are met. These markers are provided for educational and analytical purposes only, must not be interpreted as financial guidance, and do not constitute a recommendation to buy, sell, or hold any financial instrument. Users must independently validate all visual cues within their own trading methodology.
No Financial Advice — Nordman Algorithms does not provide discretionary trading signals, investment advice, or managed signal services. Our software represents a mathematical visualization of historical and real-time data. The appearance of a visual marker does not guarantee a profitable trade or predict future market behavior.
Trading Risk Warning — Futures, Forex, and options trading involve significant risk. Risk capital is money that can be lost without jeopardizing financial security. Only risk capital should be used for trading. Past performance is not indicative of future results. View Full Risk Disclosure: https://www.nordman-algorithms.com/risk-disclosure/
ESMA Risk Warning — Financial instruments, especially those involving leverage such as CFDs and Forex, are complex and carry a high risk of rapid financial loss. Our software provides analytical outputs and visual markers based on predefined mathematical conditions and does not mitigate or reduce inherent market risks. You should carefully consider whether you understand how leveraged financial instruments work and whether you can afford the high risk of losing your capital.
CFTC Rule 4.41 — Hypothetical or simulated performance results have inherent limitations. Unlike actual performance records, simulated results do not represent real trading. Because trades have not actually been executed, these results may under- or over-compensate for the impact of market factors such as liquidity. No representation is being made that any account will achieve profits or losses similar to those shown.