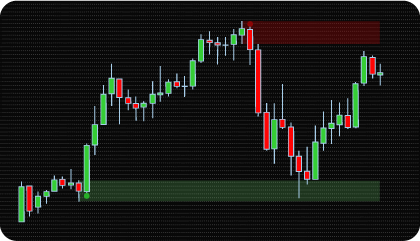
The NinjaTrader Premium & Discount Zones Indicator is built on the ICT and Smart Money methodology, formalizing the principle of price distribution relative to its fair value. Fair value is defined as the midpoint of the range (equilibrium), serving as a key reference point for evaluating current price position and dividing the range into Premium and Discount zones in relation to market balance.
From a practical standpoint, the indicator provides traders with a tool for evaluating price in the context of market equilibrium. It is not simply a visual split of the chart into top and bottom, but a structured methodology for understanding where price is “expensive” or “cheap” based on liquidity distribution and institutional logic.
Identifying the current market zone provides a structured framework for technical analysis and market context evaluation:
In this way, the NinjaTrader Premium & Discount Zones Indicator helps clearly identify whether an asset is trading at a premium or discount relative to its equilibrium, and use this context to find optimal entry and exit levels.
The NinjaTrader Premium & Discount Zones Indicator provides practical and convenient tools, allowing traders to adjust settings for different trading styles and approaches. These features include:
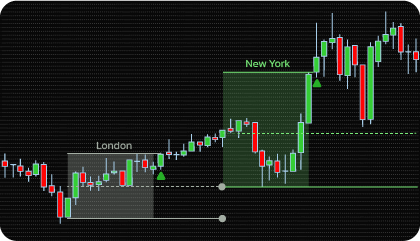
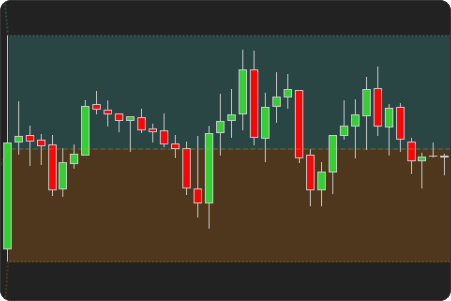
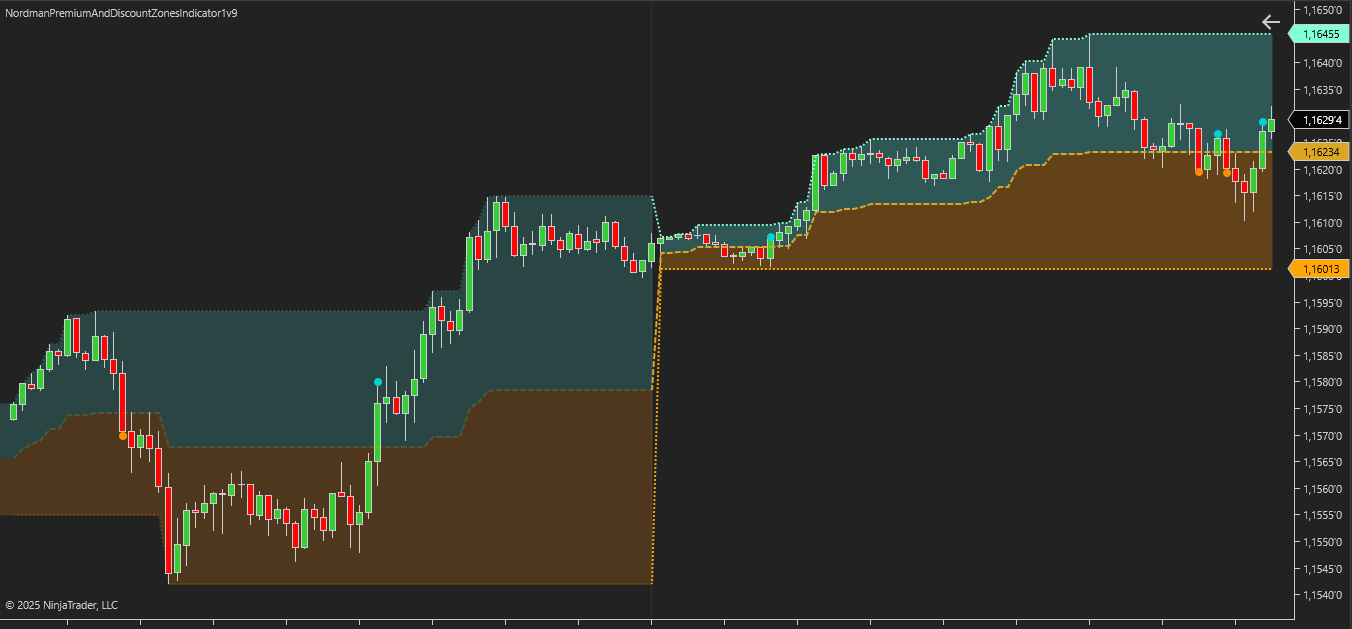
Building Zones by Sessions, Days, and Weeks
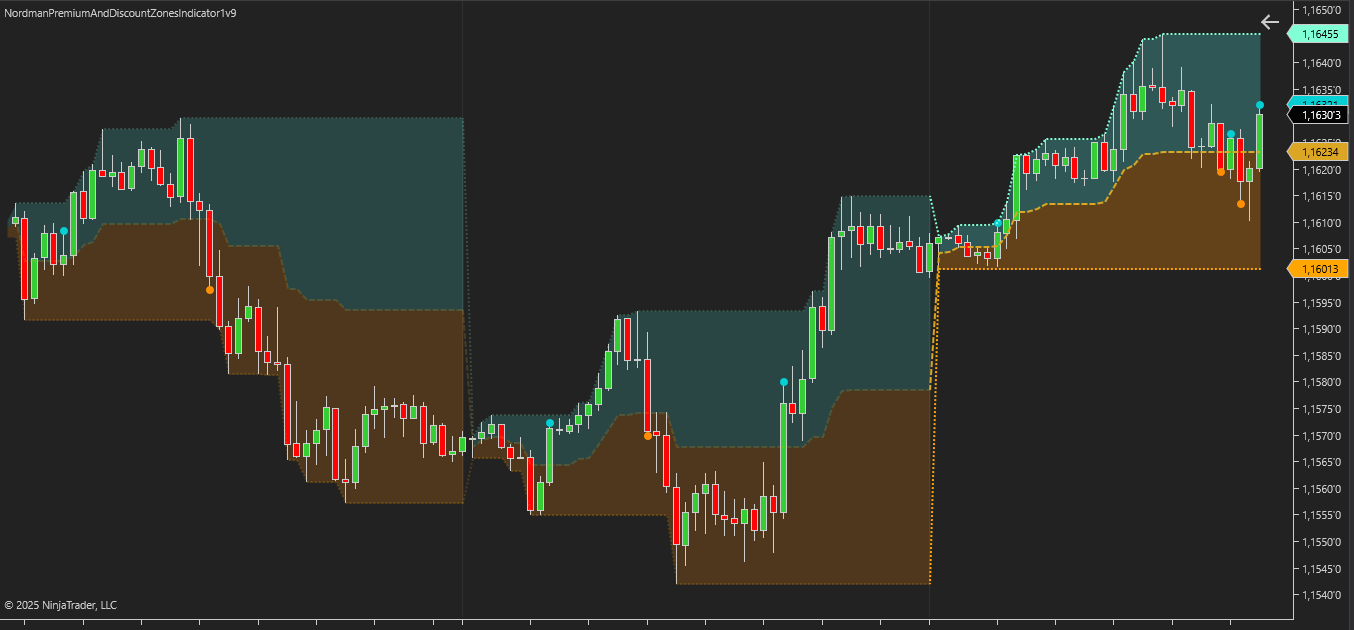
The Premium & Discount Zones Indicator builds zones for Session, Day, and Week periods, calculating the range based on High and Low extremes and automatically updating it as new values form. This approach allows traders to see the current premium and discount levels in the context of daily, weekly, or session movements, providing a clear view of the boundaries of the current market range. It is especially useful for analyzing intraday dynamics and for traders who build strategies around fixed ranges.
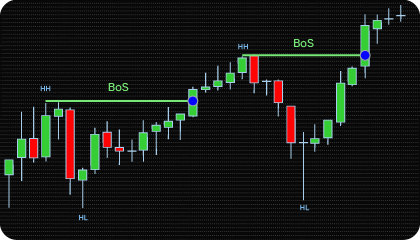
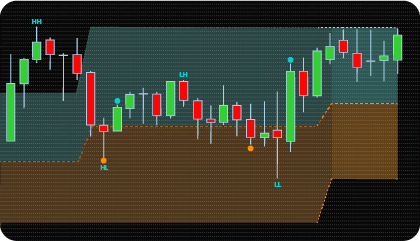
Building Zones Based on the Last Swing Point
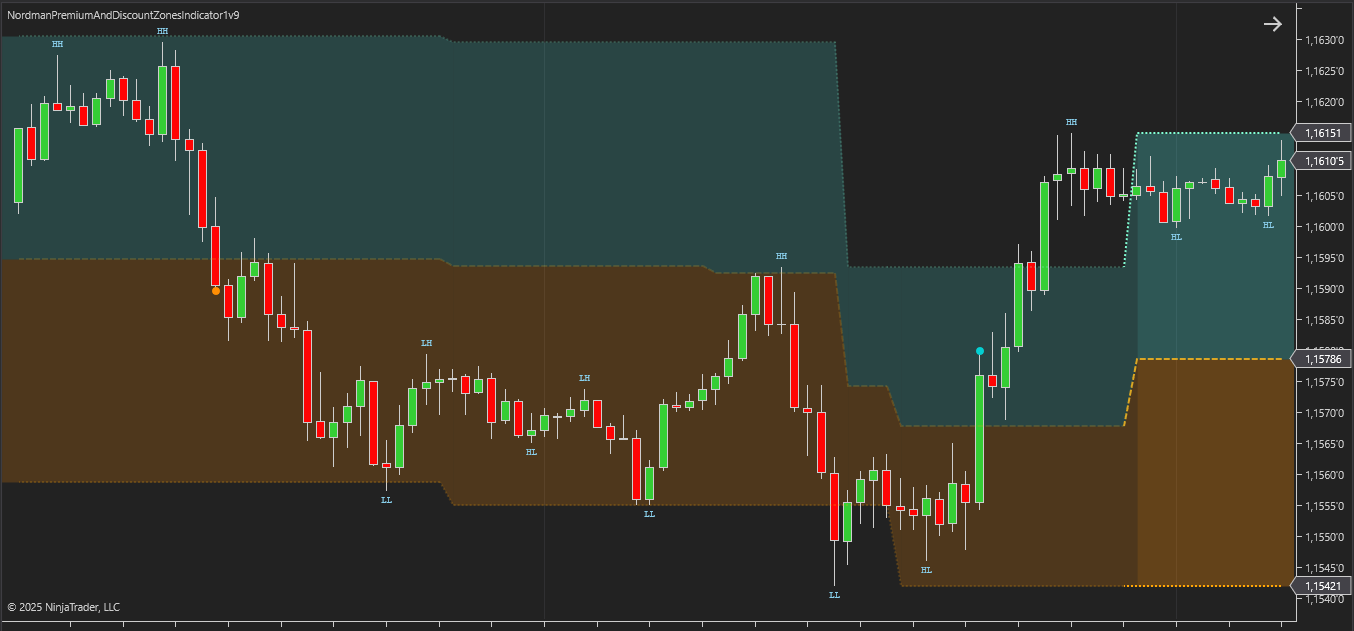
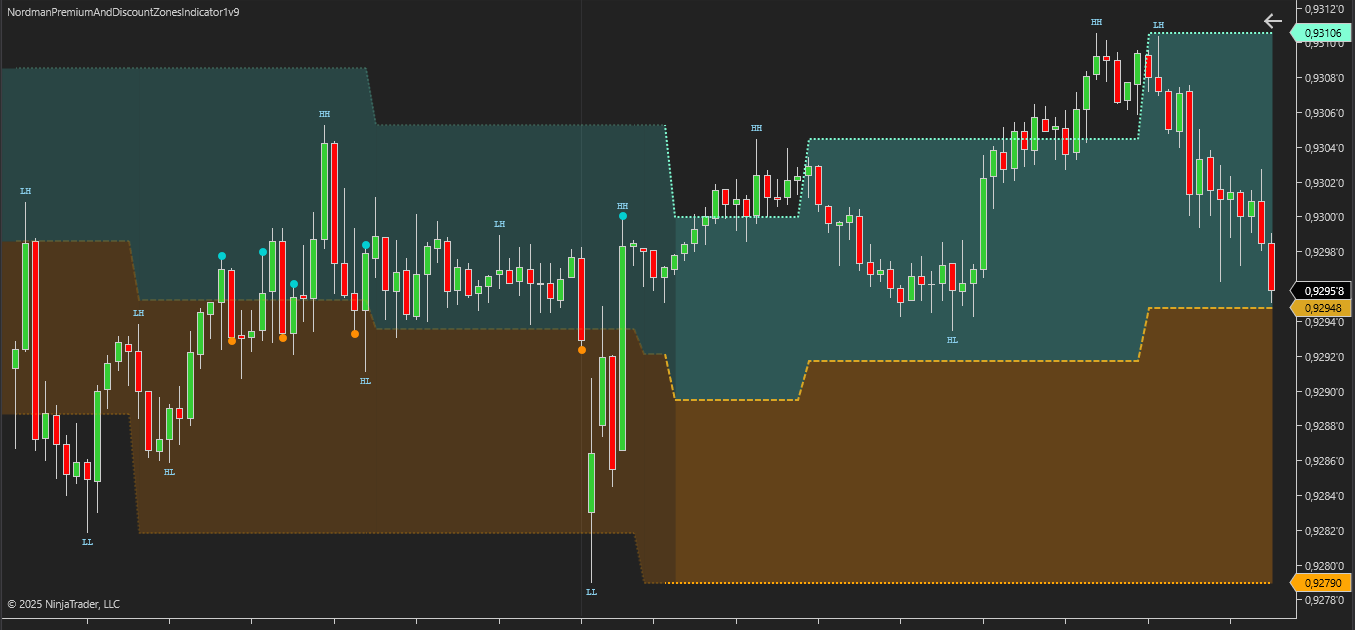
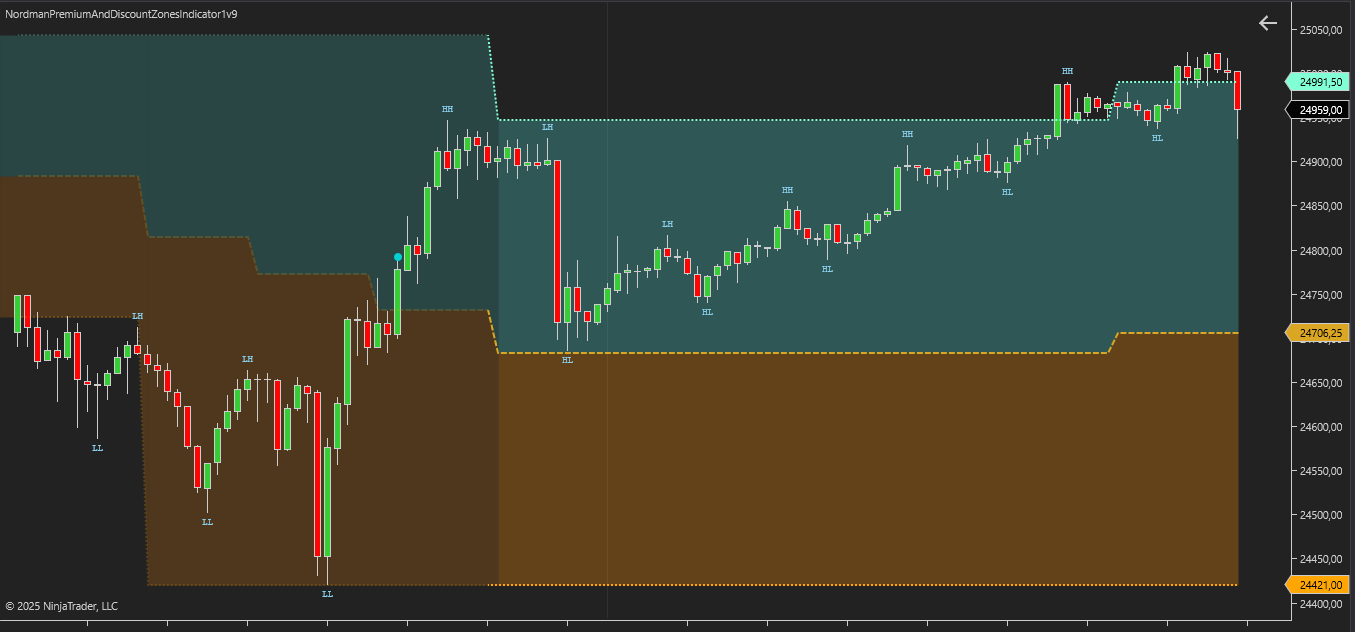
In Last Swing mode, the indicator defines Premium and Discount zone ranges based on the most recent confirmed local highs and lows (HH and LL). This approach allows traders to focus on the current market structure, emphasizing the most significant recent price impulses. Swing-based zones are especially useful for strategies involving trend changes, extreme confirmations, or market reversal analysis. The indicator automatically updates zones as new swings form, providing flexible adaptation to the current market phase.
A key feature of this mode is that the range does not update immediately when price touches an extreme, but only after the swing has been confirmed. Zone updates on the chart occur only when the local high or low is validated according to fractal logic. This is controlled by the Swing Strength parameter, which sets the number of bars required to confirm a swing. Higher values increase the strictness of the filter: an extreme is recognized only if it is surrounded by a sufficient number of bars with lower highs (for a peak) or higher lows (for a trough). This approach reduces false zone updates and provides a more structured and accurate representation of market dynamics.
Custom Time Range
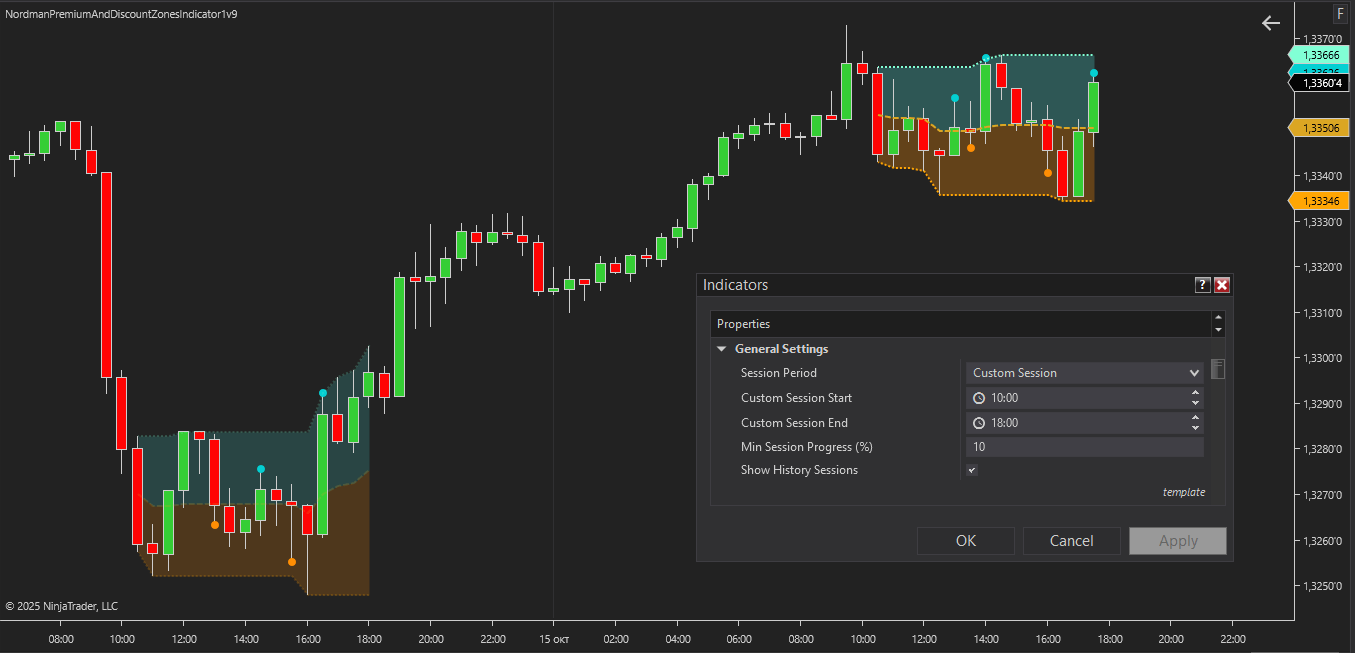
The indicator supports a Custom Session mode, allowing traders to define their own time range with minute-level precision. This is especially useful for strategies targeting non-standard trading periods, such as the European market open or localized periods of high activity. The ability to customize the time range makes the tool versatile: it can be adapted for both intraday and positional trading, highlighting periods where liquidity is concentrated or volatility is at its peak.
Additional Analysis Levels
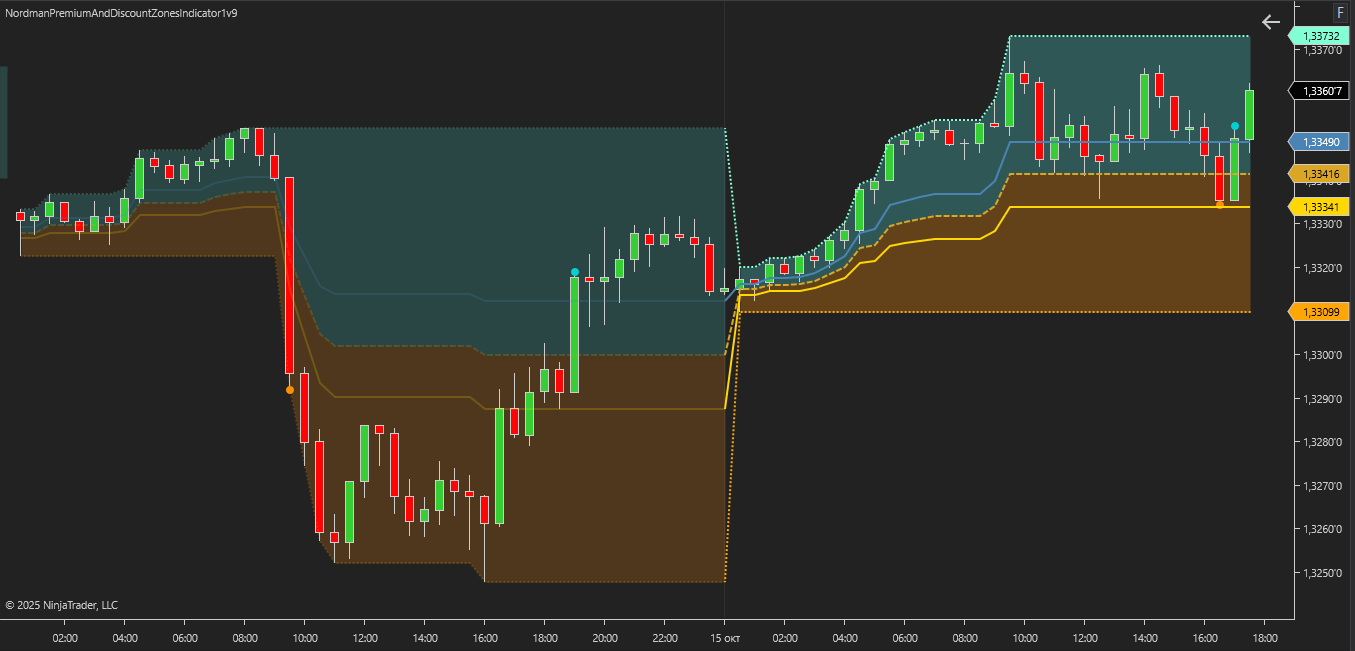
For more detailed zone analysis, the indicator provides optional levels — the classic 38.2% and 61.8%, or, if needed, 25% and 75%. These levels help identify deeper Premium and Discount areas within the range, allowing further examination of price interaction at structural boundaries. In ICT methodology, such areas are considered key entry points, as they often serve as liquidity zones and triggers for new impulses. Using additional levels allows traders not only to monitor the base 50% balance but also to analyze more precise boundaries that may provide additional context for evaluating market reactions. These levels can also serve as thresholds for refining visual markers, enabling a more structured identification of potential zones of interest while aligning with your personal market methodology.
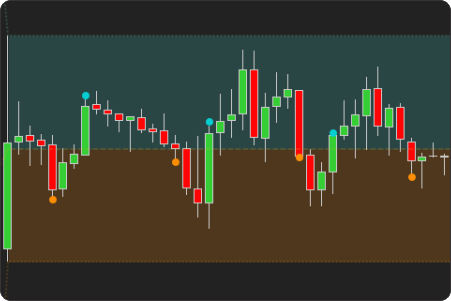
Alerts & Visual Marker System
The indicator includes an advanced alert and notification system for tracking key market events. Visual markers can be triggered upon equilibrium crossovers or at specific Fibonacci levels. Flexible configuration options allow you to disable on-chart markers when using the indicator alongside other tools, ensuring a clean and focused workspace.
Flexible Visualization Settings
To improve clarity, the indicator offers extended visualization settings. Traders can adjust the colors of Equilibrium, Discount, and Premium zones, enable or disable zone shading, modify line colors and styles, and control transparency. This allows users to tailor the display to their personal workflow while preserving analytical convenience when combining with other indicators. Clear visualization enhances chart readability and supports structured technical analysis.
The indicator has the following parameters:
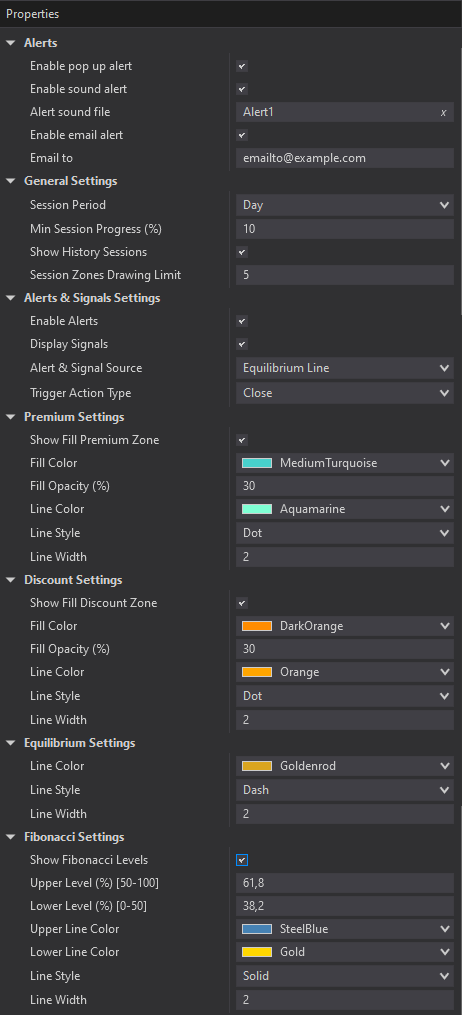
Alerts – Configure various types of alerts.
Swing Strength – Defines the number of bars the indicator considers when identifying local highs and lows based on fractal logic. A higher value increases the strictness of the swing definition, as the extreme must be surrounded by more bars with lower highs (for a top) or higher lows (for a bottom).
Session Period – selects the type of range calculation. Options: Last Swing (based on the most recent confirmed local highs and lows) or Session, Day, Week, Custom Session (time-based periods). Determines the extremes and the period used to form Premium and Discount zones.
Min Session Progress (%) – minimum session progress percentage before signals are activated. Prevents signals at the session start when the range is not yet formed and reference points are unclear.
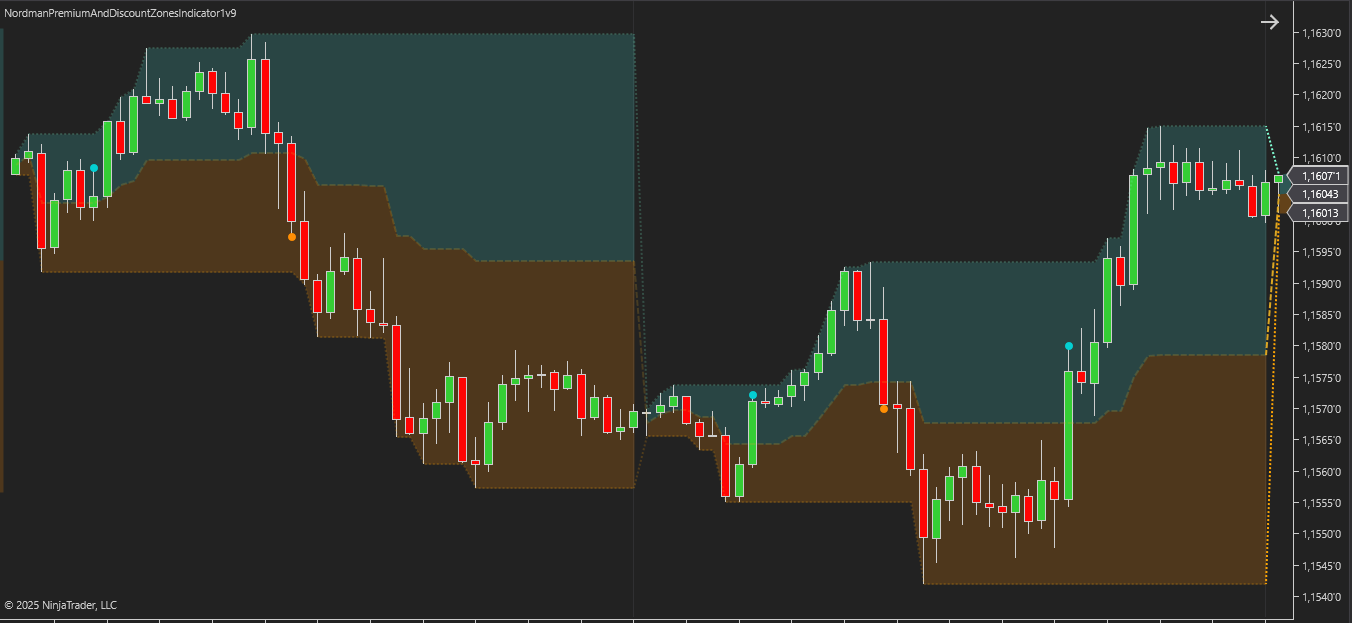
Show History Sessions – enables or disables the display of past zones built according to the selected range calculation type (Session, Day, Week, Custom Session, or Last Swing). If disabled, only the current zone is shown on the chart.
Session/Swing Zones Drawing Limit – limits the number of past zones, built according to the selected range calculation type (Session, Day, Week, Custom Session, or Last Swing), displayed on the chart.
Enable Alerts – enables or disables notifications when key zone levels are crossed.
Display Signals – enables or disables visual markers on the chart for crossings of Equilibrium or Fibonacci levels.
Alert & Signal Source – defines the specific market events used to trigger notifications: Equilibrium cross, Fibonacci level cross, or both.
Trigger Action Type – the price type used for triggering alerts and markers (Close or High/Low). Determines which price value is evaluated to confirm a level crossing event.
Show Fibonacci Level – enables or disables additional Fibonacci levels.

We can customize this indicator to your needs — adding functions, modifying logic, or integrating it with other tools for your workflow.
We also convert indicators into Automated Trading Strategies with advanced functions (trailing stops, risk management, filters) tailored to your trading style strictly according to your specifications.
Request a free consultation to discuss the technical scope and timeline of your project.
We are committed to the ongoing development and refinement of our indicators. If you’ve spotted a bug, feel that something essential is missing, or have ideas that could make the indicator even better, just send us a message. Your feedback helps us improve and deliver tools that truly meet traders’ needs.
The indicator provides a set of exposed analytical plot outputs designed for structured integration with third-party strategy builders and automation tools such as BloodHound and BlackBird (SharkIndicators), as well as other algorithmic trading environments.
| Analytical Plot Name | Output Values | Description |
| EnterDiscountZone | Value | |
| EnterPremiumZone | Value | |
| EquilibriumLine | Value | |
| PremiumLine | Value | |
| DiscountLine | Value | |
| FibUpperLine | Value | |
| FibLowerLine | Value |
Nordman Algorithms is a trade name of Nordman Algorithms OÜ (Reg. No. 14435535), registered in Tallinn, Estonia.
Software Nature & User Responsibility — Nordman Algorithms provides algorithmic software tools for technical analysis. Nordman Algorithms is not a financial advisor and is not liable for any losses. All trades conducted based on the software’s output are executed at the user’s sole discretion and risk.
Visual Markers & Signal Disclosure — This software may display visual markers (such as arrows, dots, or alerts) when predefined mathematical conditions are met. These markers are provided for educational and analytical purposes only, must not be interpreted as financial guidance, and do not constitute a recommendation to buy, sell, or hold any financial instrument. Users must independently validate all visual cues within their own trading methodology.
No Financial Advice — Nordman Algorithms does not provide discretionary trading signals, investment advice, or managed signal services. Our software represents a mathematical visualization of historical and real-time data. The appearance of a visual marker does not guarantee a profitable trade or predict future market behavior.
Trading Risk Warning — Futures, Forex, and options trading involve significant risk. Risk capital is money that can be lost without jeopardizing financial security. Only risk capital should be used for trading. Past performance is not indicative of future results. View Full Risk Disclosure: https://www.nordman-algorithms.com/risk-disclosure/
ESMA Risk Warning — Financial instruments, especially those involving leverage such as CFDs and Forex, are complex and carry a high risk of rapid financial loss. Our software provides analytical outputs and visual markers based on predefined mathematical conditions and does not mitigate or reduce inherent market risks. You should carefully consider whether you understand how leveraged financial instruments work and whether you can afford the high risk of losing your capital.
CFTC Rule 4.41 — Hypothetical or simulated performance results have inherent limitations. Unlike actual performance records, simulated results do not represent real trading. Because trades have not actually been executed, these results may under- or over-compensate for the impact of market factors such as liquidity. No representation is being made that any account will achieve profits or losses similar to those shown.
Trademark Notice — NinjaTrader® is a registered trademark of NinjaTrader Group, LLC. No NinjaTrader company has any affiliation with the owner, developer, or provider of the products or services described herein, or any interest, ownership or otherwise, in any such product or service, or endorses, recommends or approves any such product or service.