NinjaTrader News Indicator is a specialized tool that integrates economic calendar data from Myfxbook directly into the NinjaTrader platform. Instead of switching between the terminal and external websites, traders receive all essential information about upcoming and past releases right on the chart.
The relevance of this approach follows from the very nature of financial markets: major macroeconomic publications act as powerful drivers of volatility. They can drastically reshape short-term market structure, affect liquidity, and trigger impulsive price movements. For this reason, understanding the news environment is an essential component of comprehensive market analysis.
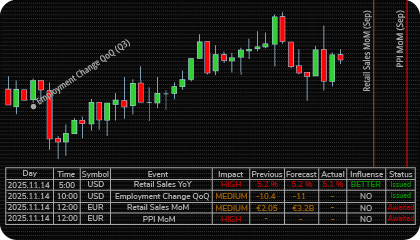
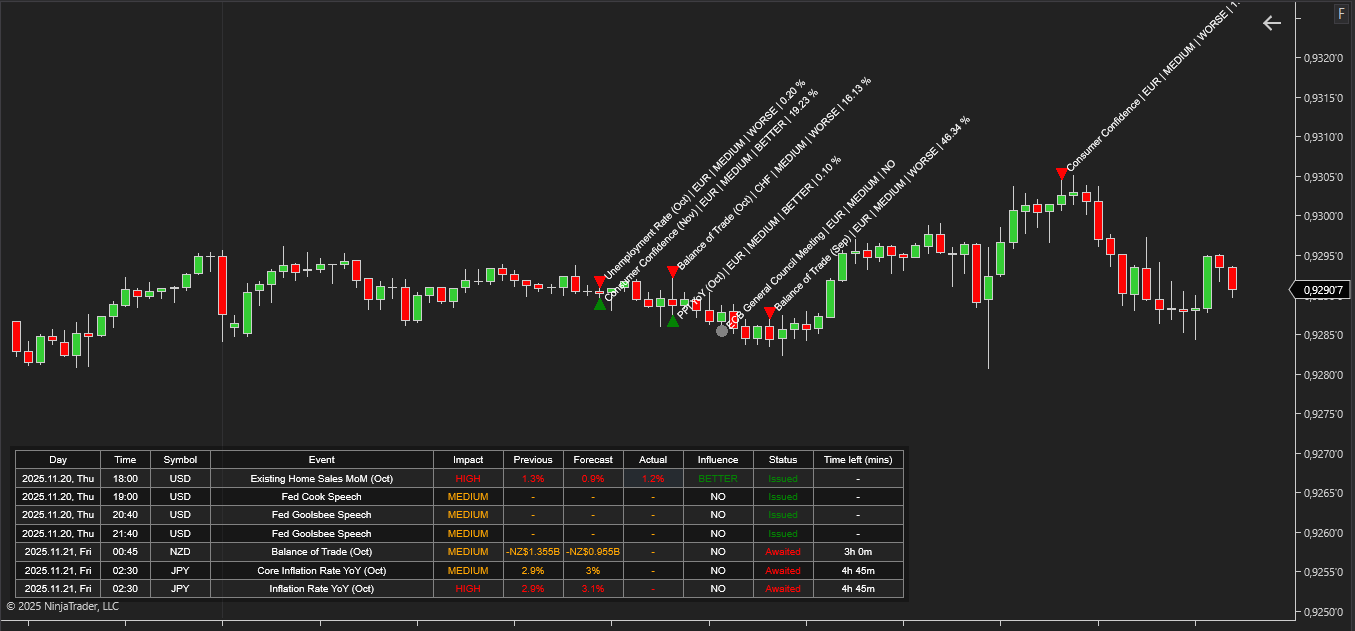
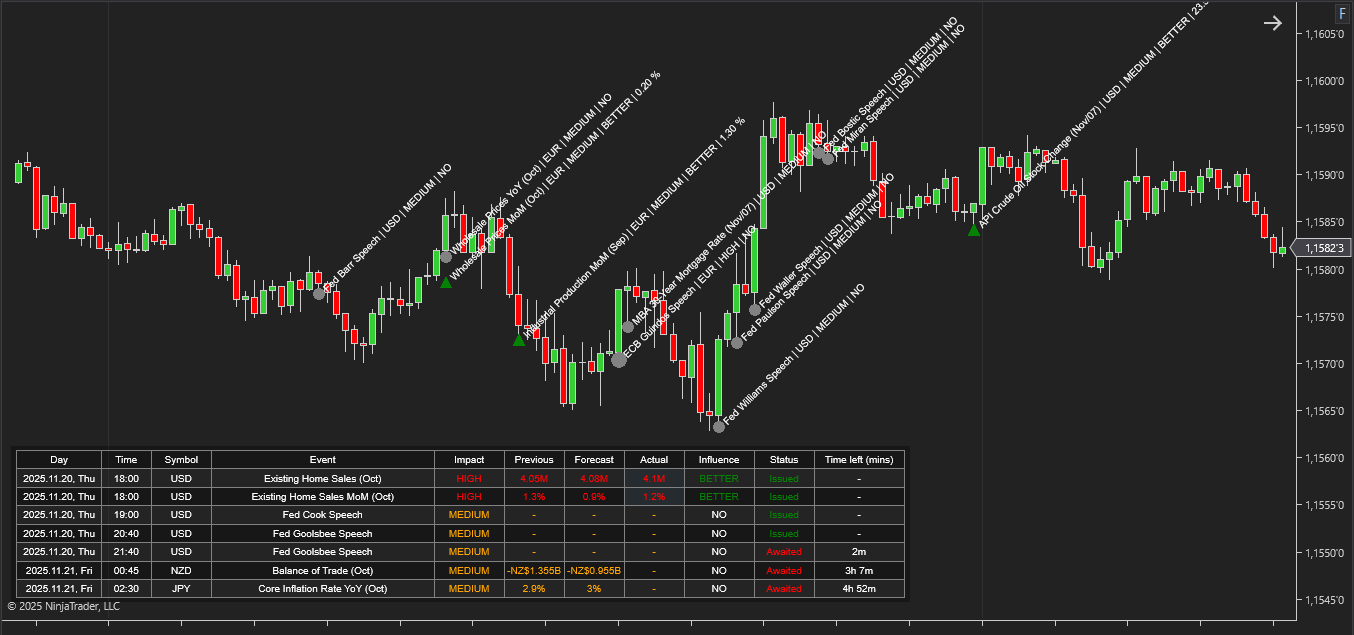
The core idea behind the NinjaTrader News Indicator is to synchronize the price chart with the flow of macroeconomic events. The indicator converts dispersed calendar data into structured on-chart markers and a tabular view, creating a direct link between fundamental releases and price behavior. Its purpose is not merely to notify the trader about an upcoming event, but to provide context: expected impact, previous reading, forecast, actual result, and the deviation from market expectations.
This approach allows traders to incorporate news into technical analysis and treat it as part of their decision-making framework. The indicator helps traders:
The News Indicator for NinjaTrader does not replace a trading strategy, but it significantly enhances analytical precision. It helps traders integrate fundamental factors into chart analysis and interpret price action in the context of real economic events, leading to more informed and balanced trading decisions.
NinjaTrader News Indicator provides a structured and fully configurable display of macroeconomic events directly on the price chart and in a dedicated dashboard. The indicator shows two categories of news:
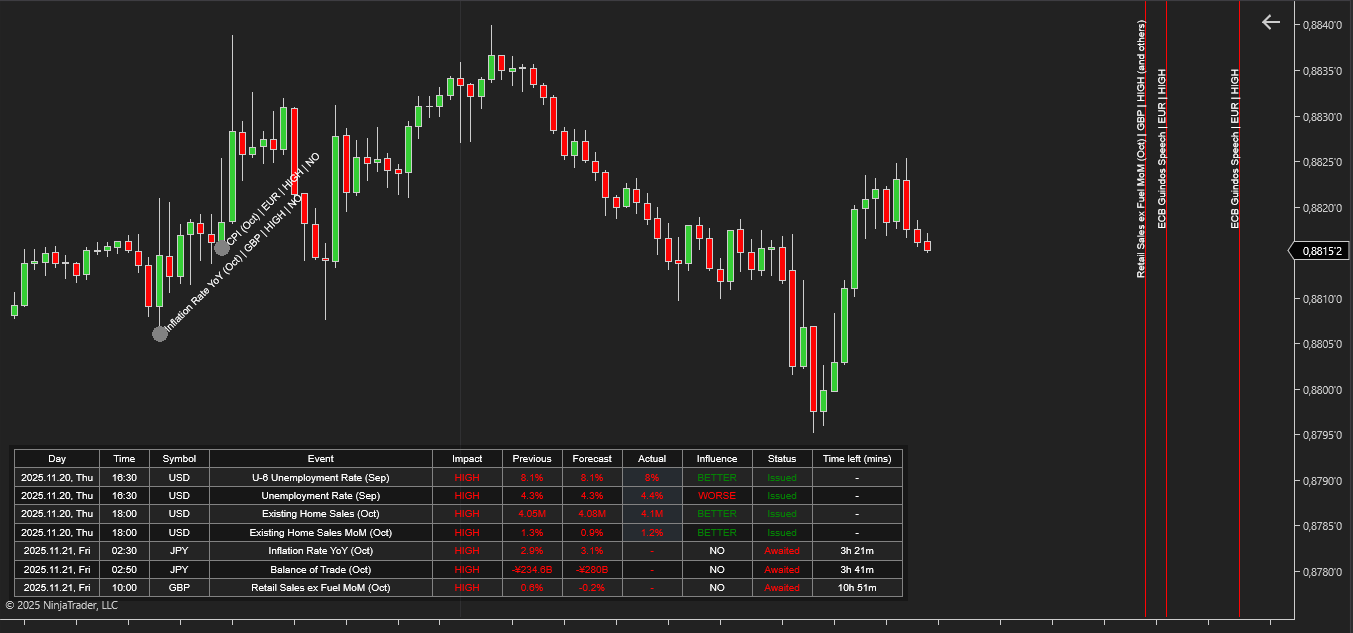
The dashboard is customizable: traders can choose to display only issued events, only awaited events, or any balanced combination (for example, the last five released and the next five upcoming).

The dashboard includes the following data for each event:
All these data points appear on both the chart and in the table, enabling traders to analyze price behavior in real time and in retrospect. The indicator also supports alerts, including pre-event notifications that can be triggered a specified number of minutes before the news release.
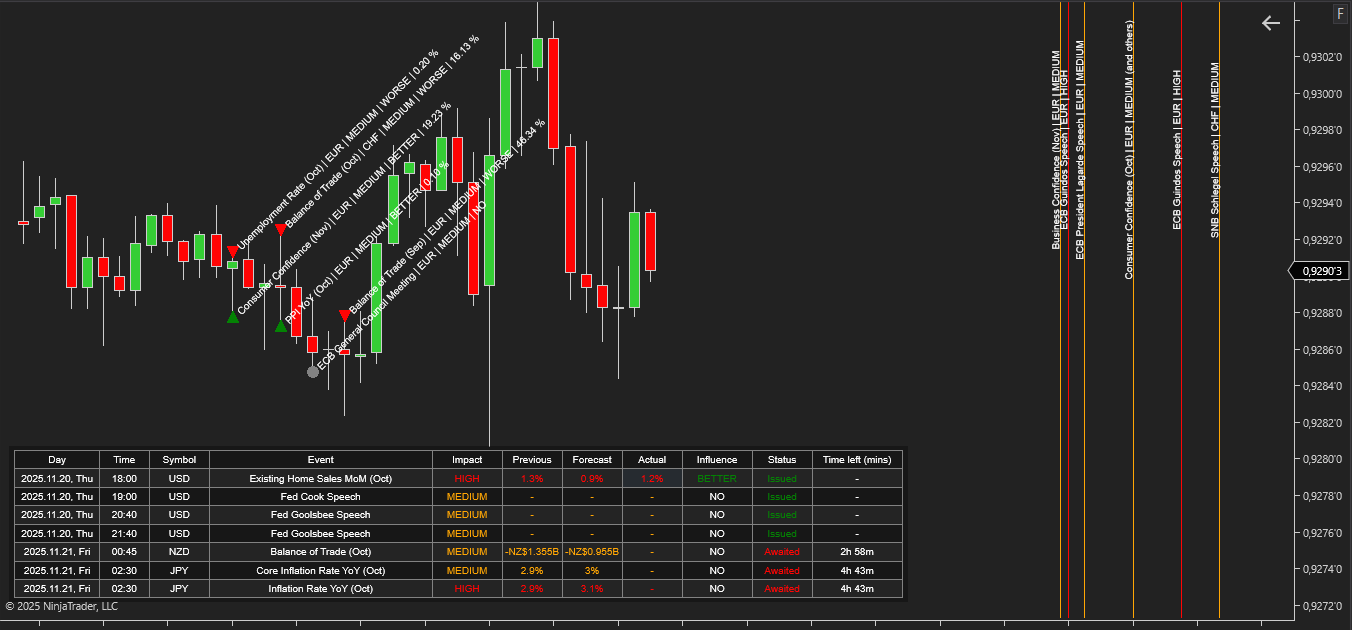
Pre-Event Analysis (Planning and Risk Assessment)
Before the release, the indicator provides the trader with everything needed to identify periods of elevated risk.
This stage is fundamentally about proactive risk management. Early visibility of Time, Symbol, and Impact helps traders avoid exposure during unpredictable high-volatility periods—or consciously engage with them—focusing on capital management, not signal generation.
Real-Time Analysis (Reaction to the Release)
When the data is issued, the indicator immediately updates the event parameters:
This enables the trader to evaluate in real time whether the market reaction aligns with the deviation from expectations.
Post-Event Analysis (Retrospective Market Evaluation)
After the release, event markers remain on the chart. This provides a basis for retrospective study—examining how a specific publication (such as a high-impact NFP report) influenced price, the strength of the resulting impulse, and the duration of the move.
Such historical context helps distinguish structural market shifts from noise and enhances overall understanding of how fundamental catalysts shape price behavior.
The indicator has the following parameters:
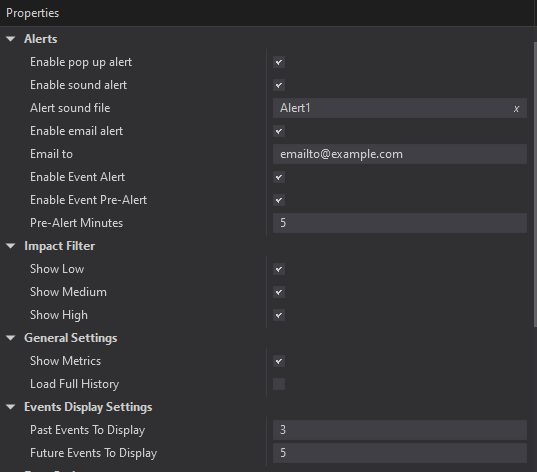
Alerts – configure various types of alerts.
Enable Event Alert – Enables alerts for news events at the moment they are released.
Enable Event Pre-Alert – Enables pre-event alerts that notify the trader before the news is published.
Pre-Alert Minutes – Defines how many minutes before the release the pre-alert should be triggered.
Impact Filter (Show Low, Medium, High) – Activates filtering of events by their Impact level. Traders can choose to display only Low, Medium, High, or any combination of impact categories.
Show Metrics – Enables the display of key data fields: Previous, Forecast, and Actual.
Load Full History – Loads the complete available history of past economic events.
Event Display Settings – Configures how many events are shown in the dashboard and which types to display (Issued or Awaited), allowing the trader to control the balance between past and upcoming events.

We can customize this indicator to your needs — adding functions, modifying logic, or integrating it with other tools for your workflow.
We also convert indicators into Automated Trading Strategies with advanced functions (trailing stops, risk management, filters) tailored to your trading style strictly according to your specifications.
Request a free consultation to discuss the technical scope and timeline of your project.
We are committed to the ongoing development and refinement of our indicators. If you’ve spotted a bug, feel that something essential is missing, or have ideas that could make the indicator even better, just send us a message. Your feedback helps us improve and deliver tools that truly meet traders’ needs.
The indicator provides a set of exposed analytical plot outputs designed for structured integration with third-party strategy builders and automation tools such as BloodHound and BlackBird (SharkIndicators), as well as other algorithmic trading environments.
| Analytical Plot Name | Output Values | Description |
| ImpactLow | Value | |
| ImpactMedium | Value | |
| ImpactHigh | Value | |
| Next Impact Low (mins) | Value | |
| Next Impact Medium (mins) | Value | |
| Next Impact High (mins) | Value | |
| Long Low | > 0 | Bullish directional detection condition |
| Long Medium | > 0 | Bullish directional detection condition |
| Long High | > 0 | Bullish directional detection condition |
| Short Low | > 0 | Bearish directional detection condition |
| Short Medium | > 0 | Bearish directional detection condition |
| Short High | > 0 | Bearish directional detection condition |
Plot output names and descriptions are technical identifiers intended solely for software integration purposes and do not constitute trading advice, signals, or recommendations.
Nordman Algorithms is a trade name of Nordman Algorithms OÜ (Reg. No. 14435535), registered in Tallinn, Estonia.
Software Nature & User Responsibility — Nordman Algorithms provides algorithmic software tools for technical analysis. Nordman Algorithms is not a financial advisor and is not liable for any losses. All trades conducted based on the software’s output are executed at the user’s sole discretion and risk.
Visual Markers & Signal Disclosure — This software may display visual markers (such as arrows, dots, or alerts) when predefined mathematical conditions are met. These markers are provided for educational and analytical purposes only, must not be interpreted as financial guidance, and do not constitute a recommendation to buy, sell, or hold any financial instrument. Users must independently validate all visual cues within their own trading methodology.
No Financial Advice — Nordman Algorithms does not provide discretionary trading signals, investment advice, or managed signal services. Our software represents a mathematical visualization of historical and real-time data. The appearance of a visual marker does not guarantee a profitable trade or predict future market behavior.
Trading Risk Warning — Futures, Forex, and options trading involve significant risk. Risk capital is money that can be lost without jeopardizing financial security. Only risk capital should be used for trading. Past performance is not indicative of future results. View Full Risk Disclosure: https://www.nordman-algorithms.com/risk-disclosure/
ESMA Risk Warning — Financial instruments, especially those involving leverage such as CFDs and Forex, are complex and carry a high risk of rapid financial loss. Our software provides analytical outputs and visual markers based on predefined mathematical conditions and does not mitigate or reduce inherent market risks. You should carefully consider whether you understand how leveraged financial instruments work and whether you can afford the high risk of losing your capital.
CFTC Rule 4.41 — Hypothetical or simulated performance results have inherent limitations. Unlike actual performance records, simulated results do not represent real trading. Because trades have not actually been executed, these results may under- or over-compensate for the impact of market factors such as liquidity. No representation is being made that any account will achieve profits or losses similar to those shown.
Trademark Notice — NinjaTrader® is a registered trademark of NinjaTrader Group, LLC. No NinjaTrader company has any affiliation with the owner, developer, or provider of the products or services described herein, or any interest, ownership or otherwise, in any such product or service, or endorses, recommends or approves any such product or service.