
NinjaTrader BOS & CHOCH and FVG Indicator is a tool based on structural analysis and the study of imbalance zones. It combines three key elements widely used in ICT/SMC methodologies: Break of Structure (BOS), Change of Character (CHoCH), and Fair Value Gap (FVG). This approach focuses on analyzing a sequence of events that form the foundation for well-reasoned trading decisions.
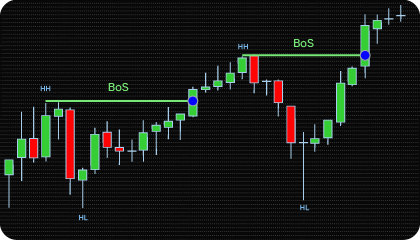
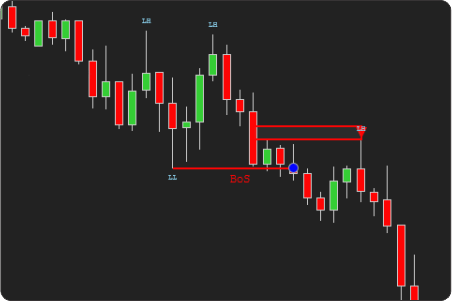
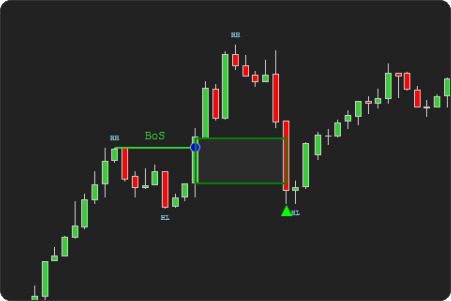
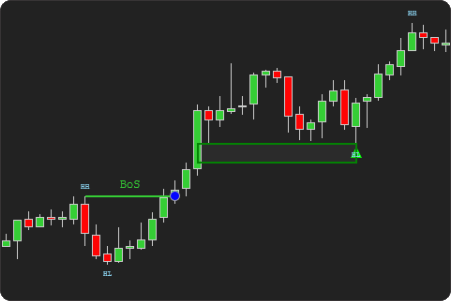
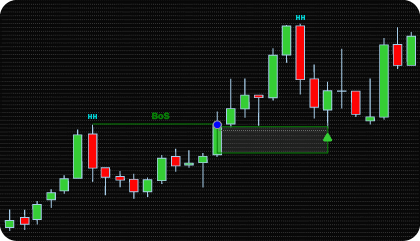
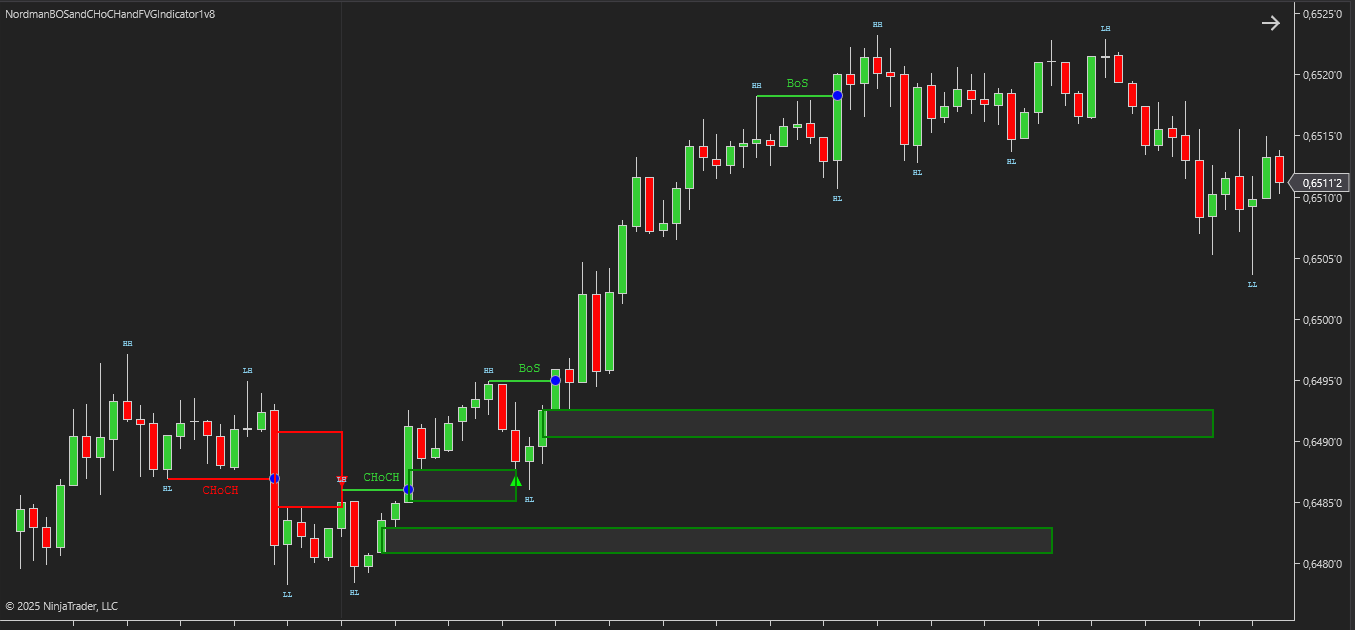
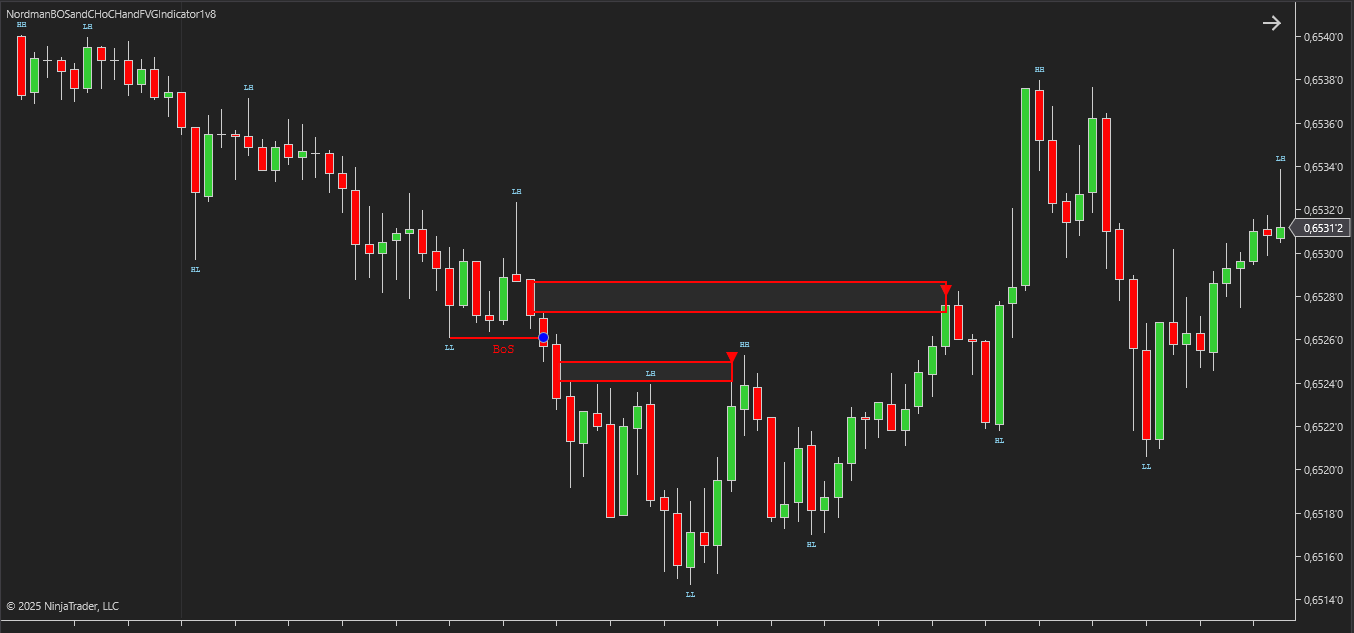
BOS reflects the moment when price breaks a local extremum in the direction of the current impulse. This confirms that momentum is maintained and is interpreted within the methodology as a potential continuation of the current momentum.
CHoCH captures a shift in direction when the sequence of highs and lows reverses, allowing early recognition of potential trend-reversal scenarios.
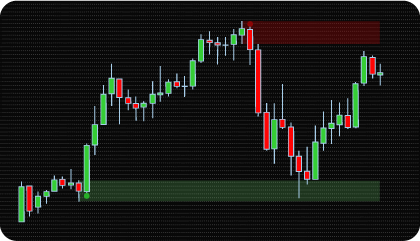
FVG is an area of price imbalance that forms during an impulsive move when price passes through a range too quickly and orders do not fully match. Such zones often become areas to which price returns before continuing its movement. A retracement into an FVG is viewed as a moment when the market compensates for the imbalance and forms a new point of interest.
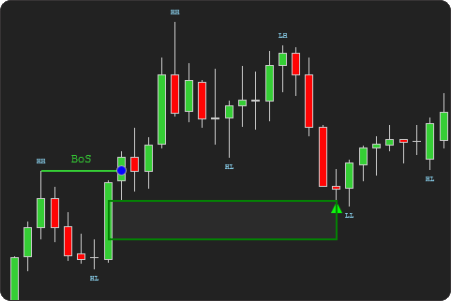
The BOS & CHOCH and FVG structure follows a logical sequence. First, a structural signal appears — either continuation of the impulse or a change in direction. This impulsive move leaves behind an imbalance zone (FVG). Later, the market returns to this area, seeking to compensate for the unfilled volume. Thus, the FVG becomes not just an area of interest, but part of a unified chain: event → consequence → compensation → potential continuation, where each stage is logically connected to the previous one and highlights areas of the most significant price reactions.
Important Note
In this indicator, the logic is designed to strictly follow the correct definition of BOS and CHoCH patterns, based on the precise sequence of swing points that indicate a change in market character.
Many similar indicators simplify the logic and interpret BOS and CHoCH as any local breakout, without verifying the necessary swing sequence. This approach ignores the overall market context and the preceding Bullish or Bearish structure, often resulting in false signals.
In this solution, BOS and CHoCH are identified only when the full swing sequence is respected. Each breakout is considered in the context of the complete structure, not as an isolated event. This ensures that real changes in market character are captured, providing consistent and precise structural analysis.
BOS and CHoCH Identification Rules
| Type BOS / CHoCH | Classic Version | Allowable Deviation |
| Bullish BOS | HL → HH → break HH ↑ | HL → HH → HL → break HH ↑ |
| Bearish BOS | LH → LL → break LL ↓ | LH → LL → LH → break LL ↓ |
| Bullish CHoCH | LL → LH → break LH ↑ | LL → LH → HL/LL → break LH ↑ |
| Bearish CHoCH | HH → HL → break HL ↓ | HH → HL → LH/HH → break HL ↓ |
BOS & CHOCH and FVG Indicator for NinjaTrader combines structure analysis with imbalance detection, helping traders visualize technical areas where price action confirms potential trend continuation or reversal scenarios.
The trading logic is based on observing how the market transitions through three phases — structure break, imbalance creation, and price retracement.
The indicator provides an additional configuration parameter — FVG Detection Mode, which defines how imbalance zones are identified in relation to BOS or CHoCH events:
By following this logic, traders can observe how structure breaks create directional bias, how imbalance zones define areas of interest, and how retracements into those zones highlight moments for well-timed trade execution. This approach highlights the technical relationship between structure and liquidity, helping to focus on areas of interest where price has historically shown significant reactions based on the selected methodology.
Additionally, to support different trading preferences and analytical approaches, the indicator includes several configuration parameters. The FVG Fill Mode setting defines how a Fair Value Gap is validated — by a simple touch, full fill, or a custom threshold percentage. Traders can also adjust the minimum gap size in price units (ticks or percentages) to filter out minor imbalances, as well as the maximum lifetime of an active FVG zone. These and other parameters allow the indicator to be tailored to individual trading styles and can be reviewed in more detail in the parameter description section.
The indicator has the following parameters:
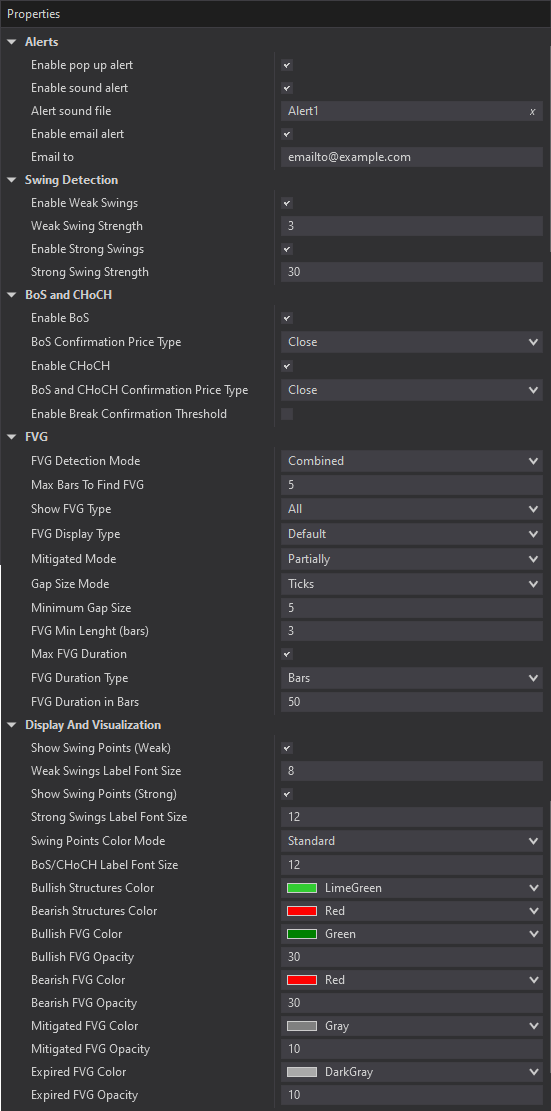
Alerts – configure various types of alerts.
Swing Strength – defines the number of bars the indicator considers when identifying local highs and lows based on fractal logic. A higher value increases the strictness of the swing definition, as the extreme must be surrounded by more bars with lower highs (for a top) or higher lows (for a bottom).
Show Swing Points – enables or disables the display of Swing Points on the chart.
Enable BoS – activates the detection of Break of Structure (BOS) on the chart.
Enable CHoCH – activates the detection of Change of Character (CHoCH) on the chart.
BoS and CHoCH Confirmation Price Type – specifies which price type is used to confirm BOS/CHoCH: candle close or high/low values.
FVG Detection Mode – FVG Detection Mode defines how the indicator identifies and processes imbalance zones in relation to structural events. Three modes are available: After BOS/CHoCH searches for FVGs only after a confirmed structure shift; BOS/CHoCH Impulse detects gaps within the impulse that forms BOS or CHoCH; and Combined uses both approaches simultaneously.
Max Bars To Find FVG – sets the maximum number of bars after a BOS or CHoCH during which the indicator searches for a valid FVG. This parameter is applicable only in the After BOS/CHoCH and Combined modes.
Mitigated Mode – determines how a Fair Value Gap is considered filled: on the first touch, after a full fill, or once a defined threshold percentage is reached.
FVG Display Type – controls how FVGs are displayed on the chart: standard mode or shrink, where zones visually contract as they are partially filled.
Gap Size Mode – defines the unit of measurement for the FVG Gap Size, representing the price distance between the candles that form the imbalance. Available options include ticks, points, or percentages.
Minimum Gap Size – sets the minimum FVG Gap Size according to the selected Gap Size Mode, filtering out minor imbalances that lack trading significance.
Minimum Bars for FVG – defines the minimum period, measured in bars, during which the FVG remains active and unfilled before being triggered by the selected method — touch, full fill, or threshold percentage.
Max FVG Duration – sets the maximum active lifetime of an FVG. If no touch, full fill, or threshold event occurs within the specified time, the FVG expires.
FVG Duration Type – defines the unit of time used for duration calculation, measured either in bars or in minutes.
FVG Duration in Bars – sets the numerical duration value corresponding to the selected FVG Duration Type.

We can customize this indicator to your needs — adding functions, modifying logic, or integrating it with other tools for your workflow.
We also convert indicators into Automated Trading Strategies with advanced functions (trailing stops, risk management, filters) tailored to your trading style strictly according to your specifications.
Request a free consultation to discuss the technical scope and timeline of your project.
We are committed to the ongoing development and refinement of our indicators. If you’ve spotted a bug, feel that something essential is missing, or have ideas that could make the indicator even better, just send us a message. Your feedback helps us improve and deliver tools that truly meet traders’ needs.
The indicator provides a set of exposed analytical plot outputs designed for structured integration with third-party strategy builders and automation tools such as BloodHound and BlackBird (SharkIndicators), as well as other algorithmic trading environments.
| Analytical Plot Name | Output Values | Description |
| Long | > 0 | Bullish directional detection condition |
| Short | > 0 | Bearish directional detection condition |
| Weak Swing HH | Value | |
| Weak Swing LH | Value | |
| Weak Swing EH | Value | |
| Weak Swing LL | Value | |
| Weak Swing HL | Value | |
| Weak Swing EL | Value | |
| Strong Swing HH | Value | |
| Strong Swing LH | Value | |
| Strong Swing EH | Value | |
| Strong Swing LL | Value | |
| Strong Swing HL | Value | |
| Strong Swing EL | Value | |
| Strong Leg High Pivot | Value | |
| Strong Leg Low Pivot | Value | |
| Bearish FVG Detected | Value | |
| Bearish FVG Low | Value | |
| Bearish FVG High | Value | |
| Bullish FVG Detected | Value | |
| Bullish FVG Low | Value | |
| Bullish FVG High | Value | |
| Bearish FVG Mitigation | Value | |
| Bullish FVG Mitigation | Value | |
| Bearish FVG Expiration | Value | |
| Bullish FVG Expiration | Value | |
| Bullish BoS | Value | |
| Bearish BoS | Value | |
| Bullish CHoCH | Value | |
| Bearish CHoCH | Value |
Plot output names and descriptions are technical identifiers intended solely for software integration purposes and do not constitute trading advice, signals, or recommendations.
Nordman Algorithms is a trade name of Nordman Algorithms OÜ (Reg. No. 14435535), registered in Tallinn, Estonia.
Software Nature & User Responsibility — Nordman Algorithms provides algorithmic software tools for technical analysis. Nordman Algorithms is not a financial advisor and is not liable for any losses. All trades conducted based on the software’s output are executed at the user’s sole discretion and risk.
Visual Markers & Signal Disclosure — This software may display visual markers (such as arrows, dots, or alerts) when predefined mathematical conditions are met. These markers are provided for educational and analytical purposes only, must not be interpreted as financial guidance, and do not constitute a recommendation to buy, sell, or hold any financial instrument. Users must independently validate all visual cues within their own trading methodology.
No Financial Advice — Nordman Algorithms does not provide discretionary trading signals, investment advice, or managed signal services. Our software represents a mathematical visualization of historical and real-time data. The appearance of a visual marker does not guarantee a profitable trade or predict future market behavior.
Trading Risk Warning — Futures, Forex, and options trading involve significant risk. Risk capital is money that can be lost without jeopardizing financial security. Only risk capital should be used for trading. Past performance is not indicative of future results. View Full Risk Disclosure: https://www.nordman-algorithms.com/risk-disclosure/
ESMA Risk Warning — Financial instruments, especially those involving leverage such as CFDs and Forex, are complex and carry a high risk of rapid financial loss. Our software provides analytical outputs and visual markers based on predefined mathematical conditions and does not mitigate or reduce inherent market risks. You should carefully consider whether you understand how leveraged financial instruments work and whether you can afford the high risk of losing your capital.
CFTC Rule 4.41 — Hypothetical or simulated performance results have inherent limitations. Unlike actual performance records, simulated results do not represent real trading. Because trades have not actually been executed, these results may under- or over-compensate for the impact of market factors such as liquidity. No representation is being made that any account will achieve profits or losses similar to those shown.
Trademark Notice — NinjaTrader® is a registered trademark of NinjaTrader Group, LLC. No NinjaTrader company has any affiliation with the owner, developer, or provider of the products or services described herein, or any interest, ownership or otherwise, in any such product or service, or endorses, recommends or approves any such product or service.