

Enable BOS / BOS Confirmation Price Type
Enables Break of Structure detection. Confirmation can be based on candle Close (stricter) or High/Low extremes (faster).
This indicator combines three core concepts from ICT (Inner Circle Trader) and Smart Money Concepts (SMC) methodologies into a single unified tool: Break of Structure (BOS), Change of Character (CHoCH), and Fair Value Gaps (FVG).
Rather than displaying these elements independently, the indicator is designed to work as a combined system — where FVG detection is directly tied to structural events, and structural signals are evaluated against a defined swing sequence rather than treated as isolated breakouts.
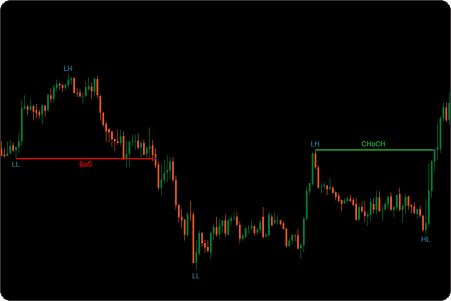
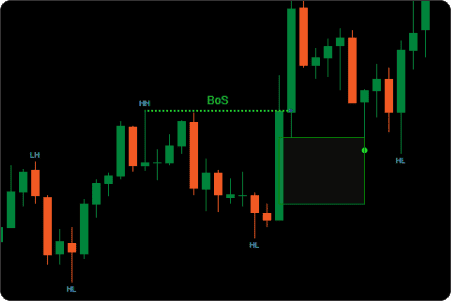
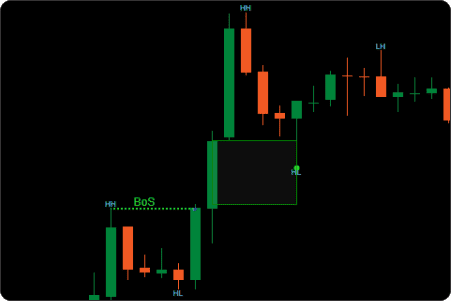
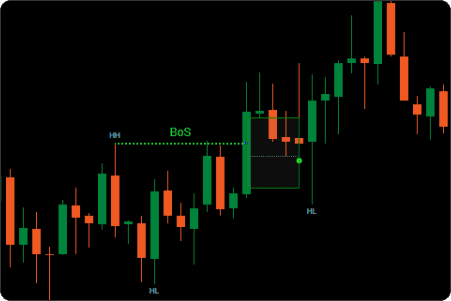
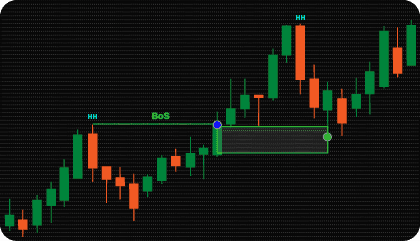
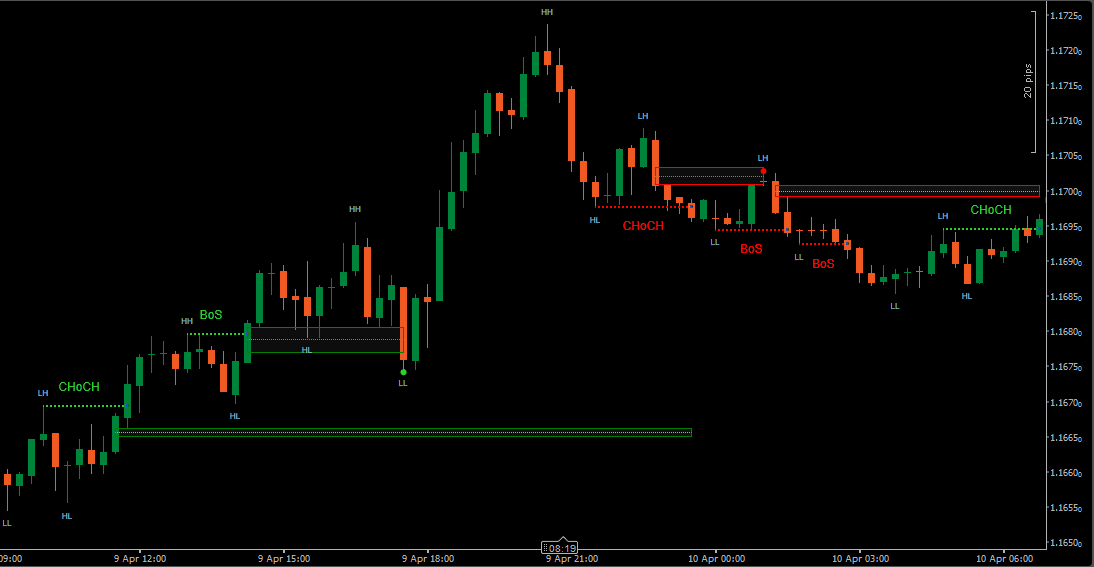
Break of Structure (BOS) occurs when price breaks beyond a confirmed swing point in the direction of the existing trend. It is commonly interpreted as continuation of the current structure.
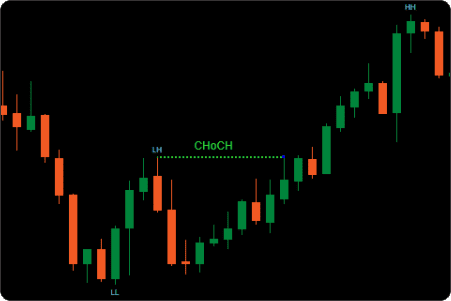
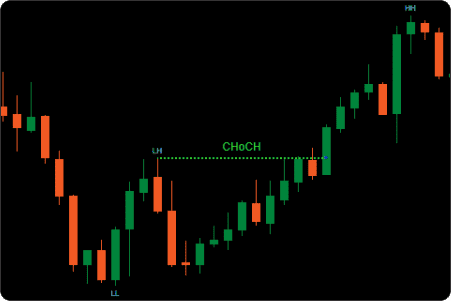
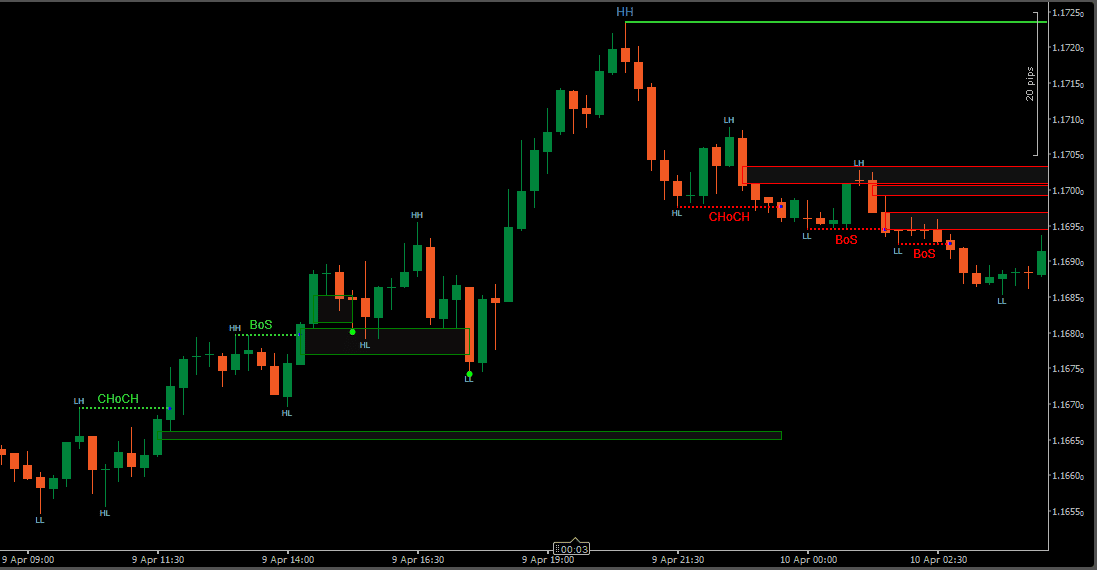
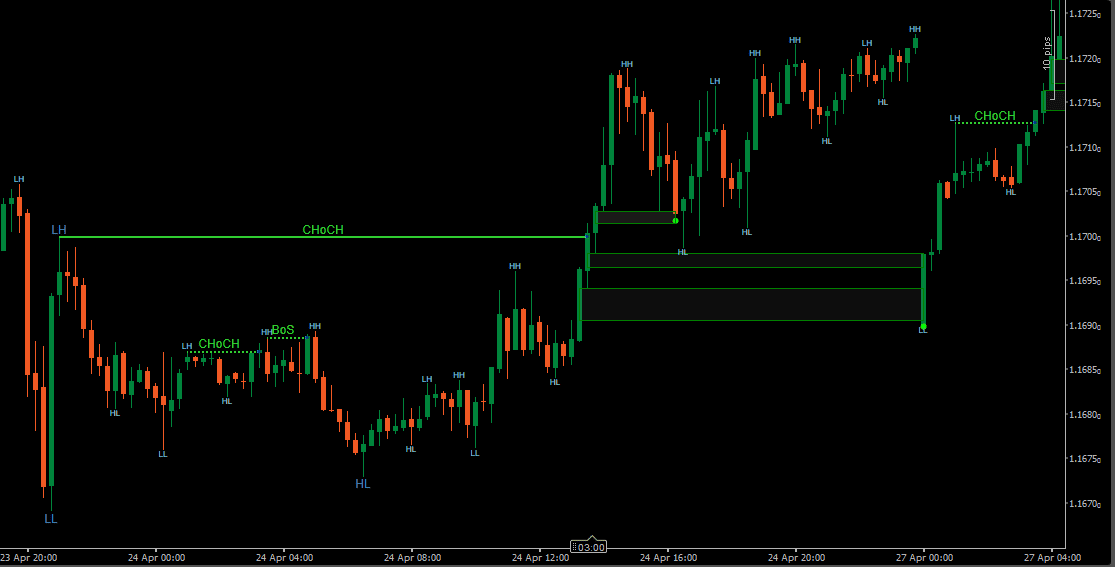
Change of Character (CHoCH) occurs when price breaks a swing point in the opposite direction of the prevailing structure — commonly interpreted as a potential shift in market character rather than continuation.
Fair Value Gaps (FVG) represent price imbalances left during strong displacement. In this indicator, FVGs are not detected independently across the entire chart — they are specifically linked to BOS and CHoCH events, making them structurally contextualized from the moment they are created.
Together, these three elements form a structured framework for reading market structure, identifying directional shifts, and locating imbalance zones that developed as part of those shifts.
Many indicators simplify BOS and CHoCH detection by treating any local breakout as a valid signal — without verifying that the required swing sequence has occurred first. This approach ignores broader market context and often produces signals that do not reflect genuine structural shifts.
In this indicator, BOS and CHoCH are confirmed only when the full swing sequence is respected. Each breakout is evaluated in the context of the preceding structure, not as an isolated event. This ensures that signals reflect validated changes in market structure rather than minor price fluctuations that happen to cross a level.
| Type | Classic Sequence | Allowable Deviation |
|---|---|---|
| Bullish BOS | HL → HH → break HH ↑ | HL → HH → HL → break HH ↑ |
| Bearish BOS | LH → LL → break LL ↓ | LH → LL → LH → break LL ↓ |
| Bullish CHoCH | LL → LH → break LH ↑ | LL → LH → HL/LL → break LH ↑ |
| Bearish CHoCH | HH → HL → break HL ↓ | HH → HL → LH/HH → break HL ↓ |
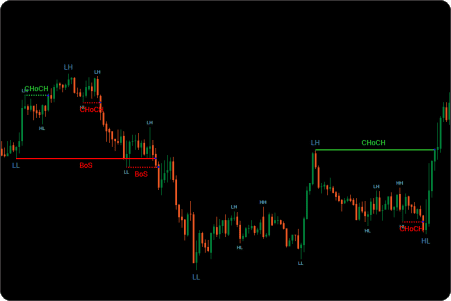
The indicator detects swing highs and swing lows on two independent structural levels — Weak and Strong — each with its own sensitivity and visual style.
Weak swings are detected using a fractal-based approach with a configurable look-back window. Lower values make the indicator more responsive to local price fluctuations, while higher values require more developed highs and lows before a swing is confirmed. Weak swings are displayed with a dotted line style and represent shorter-term structural points.
Strong swings follow the same fractal principle, but with a longer look-back period — confirming only swing points that remain uncontested by subsequent price action over a greater number of bars. This produces a cleaner, higher-timeframe structural view. Strong swings are displayed with a solid line style and represent the broader market structure the indicator uses to evaluate BOS and CHoCH on a higher level.
Both layers can be enabled or disabled independently, and their swing point labels and font sizes can be configured separately.
BOS and CHoCH signals are detected independently on both the Weak and Strong swing layers, giving a multi-level view of structural events as they develop.
Both signals support two confirmation modes: Close-based confirmation requires the candle to close beyond the structural level before the signal is registered. High/Low-based confirmation reacts as soon as price extremes exceed the level. Close mode is stricter. High/Low mode is faster.
An optional Break Confirmation Threshold adds an additional distance requirement — price must move a specified amount beyond the structural level (in ticks, points, or percentage) before the signal is confirmed. This helps filter marginal breaks around the structural level.
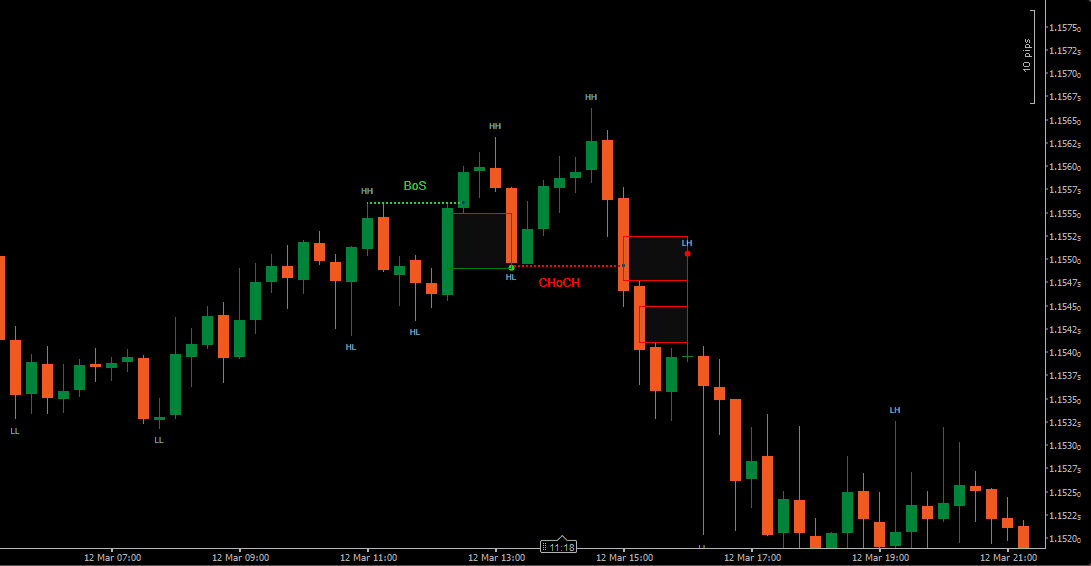
The most distinctive feature of this indicator is how Fair Value Gaps are detected. Rather than scanning the entire chart for any imbalance, FVGs are specifically linked to BOS and CHoCH events — making every detected gap structurally contextualized from the moment it forms.
Three detection modes are available:
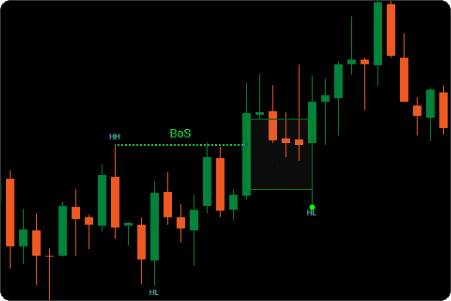
After BOS/CHoCH — the indicator searches for an FVG in the bars immediately following a structural break. This focuses attention on imbalances that formed as price moved away after the breakout.
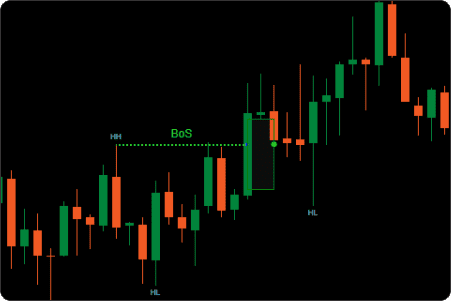
BOS/CHoCH Impulse — the indicator searches for FVGs within the impulse move that caused the structural break — both in the bars leading up to and just after the breakout bar. This captures imbalances that were part of the displacement itself.
Combined — both approaches run simultaneously, detecting FVGs from the impulse and from the post-break continuation. This is the most comprehensive mode.
Because FVGs are tied to structural events, they carry structure context that standalone FVG tools may not include by default.
Detected FVG zones move through the same Active / Mitigated / Expired state model used in the standalone FVG indicator. Zone lifetime can be measured in bars or minutes.
Three mitigation models are available: Full (complete fill required), Partial (first entry into the zone), and Threshold (a defined percentage of zone depth must be filled). Mitigation can be confirmed using High/Low or Close prices.
Shrink Mode is available — the zone contracts visually as price partially fills the imbalance, making ongoing mitigation easier to follow in real time.
The indicator provides buy and sell signal outputs that can be used for active monitoring or integration with other cTrader tools.
Alerts can be delivered as popup messages, sound notifications, or email — and can be configured independently based on workflow requirements.
Run it as a visual structure analysis tool, or use the signals and alerts for active monitoring.
The two swing layers provide different perspectives on the same price action. Weak swings show the shorter-term structural picture — the sequence of local highs and lows that forms the immediate context. Strong swings show the broader structural picture — the major swing points that define the current directional bias.
Monitoring both layers simultaneously allows tracking structure at multiple levels without switching timeframes.
BOS and CHoCH events do not generate signals directly. Instead, they trigger the search for a Fair Value Gap — and it is the FVG that carries the signal logic.
The process works in three steps. First, a BOS or CHoCH is confirmed when the required swing sequence is complete and price breaks the structural level. Second, the indicator searches for an FVG that formed in connection with that structural event — either in the impulse that caused the break, in the bars following it, or both, depending on the selected detection mode. Third, when price later returns and mitigates that FVG, a bullish signal is generated for a bullish FVG mitigation, or a bearish signal for a bearish FVG mitigation.
This means signals always appear at the FVG level — not at the BOS or CHoCH level. The structural event provides the context, the FVG provides the zone, and the mitigation provides the signal.
Three conditions must align before a signal appears: a verified structural break, a linked FVG, and price returning to mitigate it. Each signal that does appear has passed through all three filters.
Enables Break of Structure detection. Confirmation can be based on candle Close (stricter) or High/Low extremes (faster).
Enables Change of Character detection. Same confirmation options as BOS — Close or High/Low.
Adds a minimum distance requirement beyond the structural level before BOS or CHoCH is confirmed. Threshold can be measured in Ticks, Points, or Percentage.
Defines how FVGs are located relative to structural events.
Defines how many bars after a structural event the indicator continues to search for an FVG. Applies to After BOS/CHoCH and Combined modes.

Need changes to this indicator? We can customize it to your specifications — adding new functions, modifying logic, refining visuals, or integrating it with other cTrader tools.
We also convert indicators into cBots with advanced features such as trailing stops, position parameter controls, execution filters, and rule-based automation built to your technical specifications.
Request a free consultation to discuss the technical scope, timeline, and available development options.
We are committed to the ongoing development and refinement of our indicators. If you’ve spotted a bug, feel that something essential is missing, or have ideas that could make the indicator even better, just send us a message. Your feedback helps us improve and deliver tools that truly meet traders’ needs.
A Break of Structure (BOS) occurs when price breaks a swing level in the same direction as the existing trend — suggesting continuation of the current move.
A Change of Character (CHoCH) occurs when price breaks a swing level in the opposite direction — indicating a potential shift in the prevailing market structure.
Both signals require a verified swing sequence before they are confirmed. A break alone is not enough.
Because a signal requires three conditions to align: a verified BOS or CHoCH with the correct swing sequence, a linked FVG that formed as part of that structural event, and price returning to mitigate that FVG.
Many similar indicators fire on any local breakout. Here, BOS and CHoCH only provide context — the actual signal is generated when the associated FVG is mitigated. This means fewer signals overall, with each signal tied to a verified swing sequence and a confirmed structural imbalance.
Weak swings are detected using a shorter look-back window and represent shorter-term structural points. They are more responsive to local price movement.
Strong swings use a longer look-back period and confirm only swing points that remain uncontested over a greater number of bars. They represent the broader structural picture and are less frequent.
Both layers can be used simultaneously, giving a multi-level view of market structure without changing the chart timeframe.
FVGs are not detected independently across the entire chart. They are specifically linked to BOS and CHoCH events — each detected imbalance is associated with the structural break that produced it.
This means every FVG on the chart has a structural origin, rather than simply being any gap between candles.
After BOS/CHoCH — searches for FVGs in the bars immediately following a structural break.
BOS/CHoCH Impulse — searches for FVGs within the impulse move that caused the structural break.
Combined — runs both approaches simultaneously, detecting FVGs from both the impulse and the post-break continuation.
Yes. BOS and CHoCH are detected independently on both the Weak and Strong swing layers when both are enabled. This provides structural signals at two different sensitivity levels simultaneously.
No. BOS and CHoCH signals are confirmed based on completed bar data and do not move retroactively. FVG zones are plotted based on completed candle data and their original boundaries do not repaint. Zone status may update to mitigated or expired as price develops, but the structural signal and zone location remain fixed.
The indicator works on any instrument available in cTrader, including Forex pairs, Gold, Indices, and CFDs.
It applies to any timeframe. The Weak and Strong swing layers allow monitoring structure at two levels without switching charts, making it easier to compare short-term and broader structure on the same chart.
Nordman Algorithms is a trade name of Nordman Algorithms OÜ (Reg. No. 14435535), registered in Tallinn, Estonia.
Software Nature & User Responsibility — Nordman Algorithms provides algorithmic software tools for technical analysis. Nordman Algorithms is not a financial advisor and is not liable for any losses. All trades conducted based on the software’s output are executed at the user’s sole discretion and risk.
Visual Markers & Signal Disclosure — This software may display visual markers (such as arrows, dots, or alerts) when predefined mathematical conditions are met. These markers are provided for educational and analytical purposes only, must not be interpreted as financial guidance, and do not constitute a recommendation to buy, sell, or hold any financial instrument. Users must independently validate all visual cues within their own trading methodology.
No Financial Advice — Nordman Algorithms does not provide discretionary trading signals, investment advice, or managed signal services. Our software represents a mathematical visualization of historical and real-time data. The appearance of a visual marker does not guarantee a profitable trade or predict future market behavior.
Trading Risk Warning — Forex, CFDs, futures, options, and other leveraged financial instruments involve significant risk. Risk capital is money that can be lost without jeopardizing financial security. Only risk capital should be used for trading. Past performance is not indicative of future results. View Full Risk Disclosure: https://www.nordman-algorithms.com/risk-disclosure/
ESMA Risk Warning — Financial instruments, especially those involving leverage such as CFDs and Forex, are complex and carry a high risk of rapid financial loss. Our software provides analytical outputs and visual markers based on predefined mathematical conditions and does not mitigate or reduce inherent market risks. You should carefully consider whether you understand how leveraged financial instruments work and whether you can afford the high risk of losing your capital.
CFTC Rule 4.41 — Hypothetical or simulated performance results have inherent limitations. Unlike actual performance records, simulated results do not represent real trading. Because trades have not actually been executed, these results may under- or over-compensate for the impact of market factors such as liquidity. No representation is being made that any account will achieve profits or losses similar to those shown.

