Market Structure Shift Concept Explained
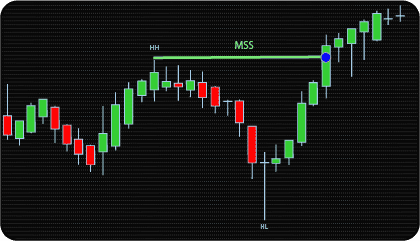
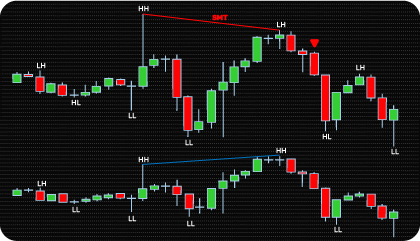
Market Structure Shift (MSS) is based on the idea that trends develop through sequences of swing highs and swing lows. Bullish conditions often produce higher highs and higher lows, while bearish conditions typically form lower highs and lower lows. When this sequence is interrupted and price breaks an opposing structural swing level, directional control may be changing.
MSS is widely used in Smart Money Concepts (SMC) and Inner Circle Trader (ICT) methodologies as an early reversal signal within developing structure. A bullish MSS occurs when price breaks above a recently confirmed swing high after bearish or neutral conditions. A bearish MSS occurs when price breaks below a recently confirmed swing low after bullish or neutral structure.
Because MSS is tied to swing structure rather than arbitrary price levels, swing quality matters. Lower sensitivity reacts faster to local fluctuations. Higher sensitivity requires more developed highs and lows before confirmation.
Swing Strength often has more impact than expected because it changes how sensitive the entire structure model becomes.
MSS events are commonly monitored when price breaks the latest validated swing level using candle closes, price extremes, or an added threshold distance requirement.
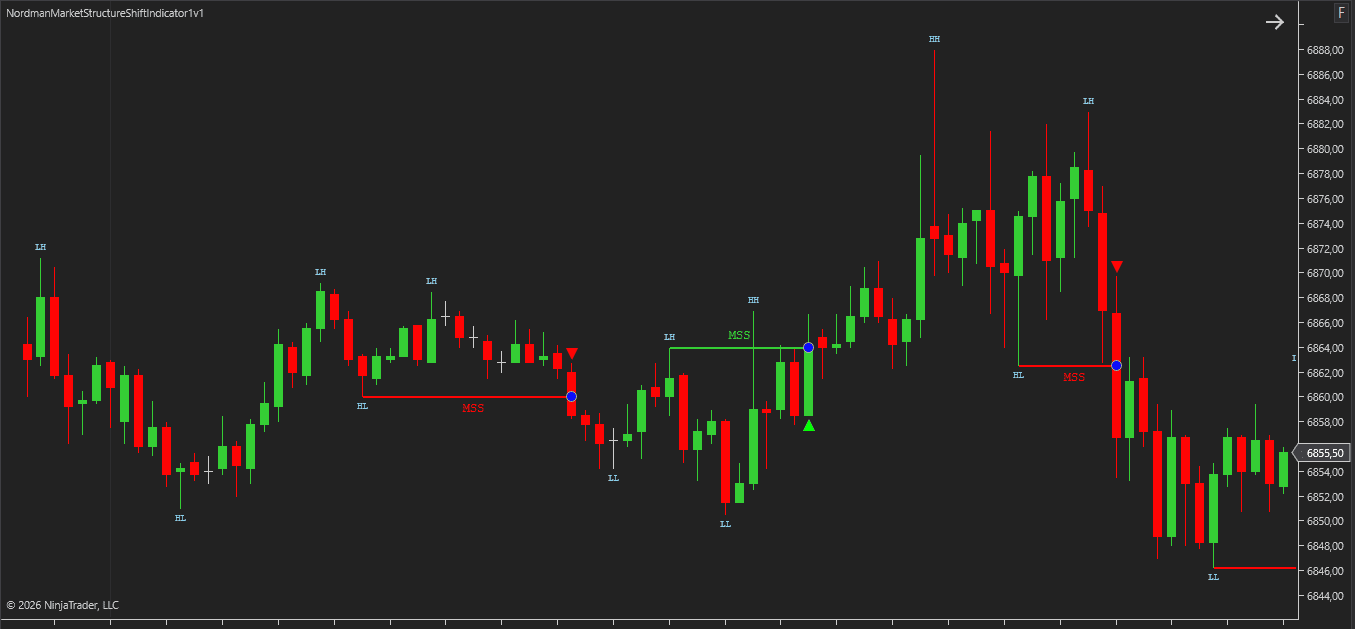
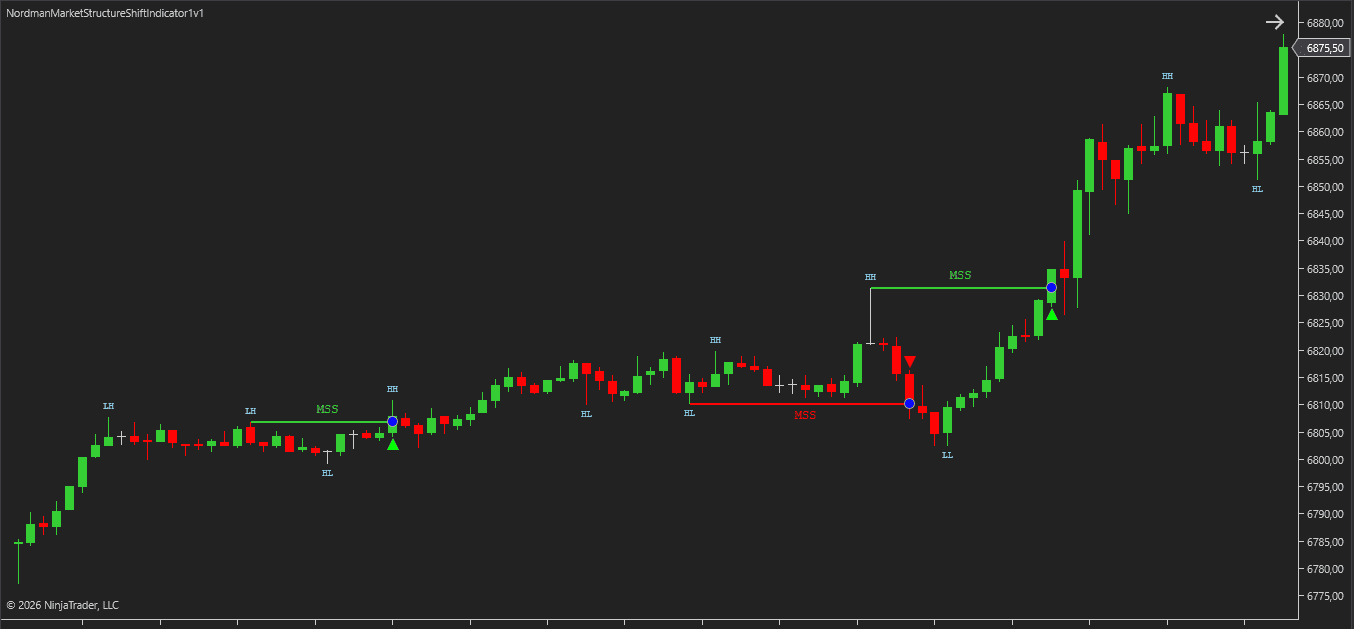
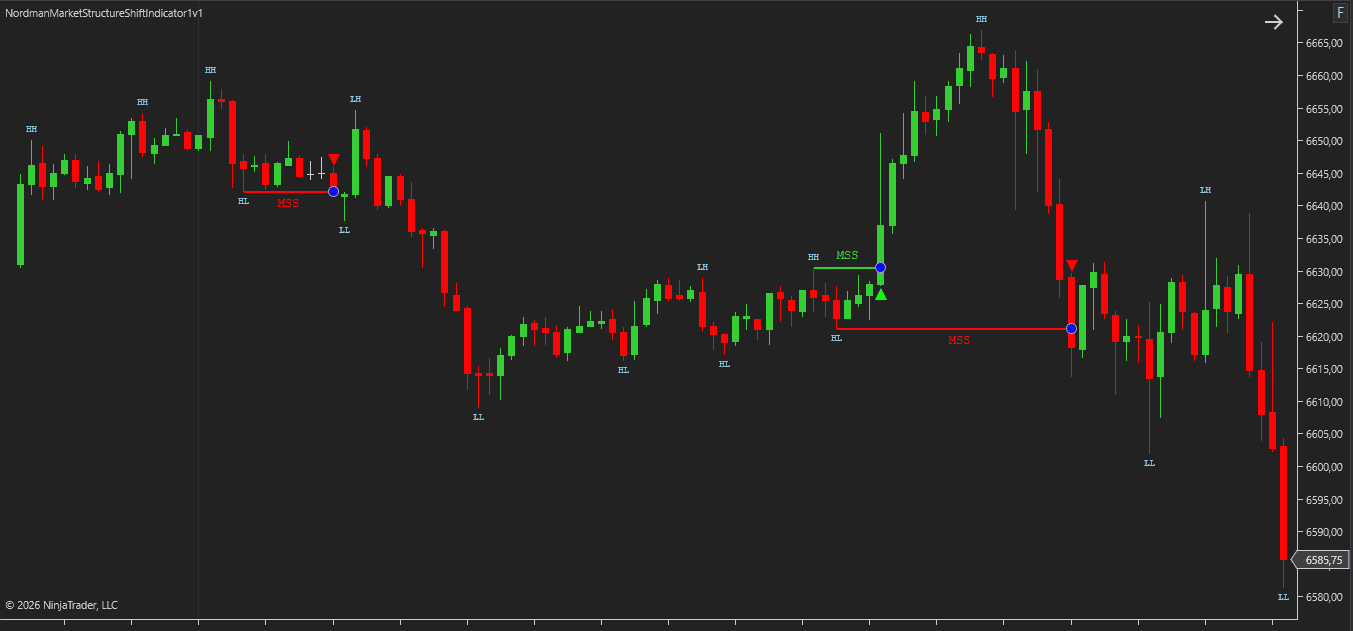
The NinjaTrader Market Structure Shift Indicator automates fractal swing detection, tracks structural levels in real time, and displays bullish or bearish MSS events directly on the chart.
MSS vs Break of Structure vs Change of Character
In market structure analysis, MSS, Break of Structure (BOS), and Change of Character (CHoCH) describe different structural events. These terms are widely used in SMC and ICT methodologies.
They all rely on swing highs and swing lows, but their purpose is different. MSS is commonly associated with early directional shifts. BOS is used to confirm continuation of the active trend. CHoCH is often interpreted as a broader reversal in market behavior.
| Concept |
Structural Role |
Typical Context |
Primary Purpose |
| MSS |
Local reversal pattern |
Short-term structure |
Early trend change detection |
| BOS |
Continuation pattern |
Active trend |
Trend continuation confirmation |
| CHoCH |
Structural reversal pattern |
Broader structure |
Major trend shift indication |
This indicator is focused on MSS-only detection, giving traders a cleaner chart without additional BOS or CHoCH overlays.
If you need combined Break of Structure and Change of Character detection, see the NinjaTrader BOS & CHoCH Indicator.
NinjaTrader Market Structure Shift Indicator — Key Features
Swing Structure Detection & Visualization
The indicator detects MSS events using confirmed swing highs and swing lows derived from fractal price structure. These structural turning points form the basis of every bullish or bearish MSS event.
The Swing Strength setting controls how strict swing confirmation must be. Lower values respond faster to short-term movement. Higher values require more developed highs and lows before a swing is accepted. This setting often matters more than expected because it influences every future MSS event.
The indicator also includes configurable Bullish and Bearish MSS filters. These allow setting a minimum number of qualifying swing points — Lower Highs or Equal Highs for bullish setups, Higher Lows or Equal Lows for bearish — before an MSS event is displayed on the chart. The internal state logic continues to operate independently, so filters affect only what is shown, not how structure is tracked.
Optional swing point markers can display confirmed highs and lows directly on the chart, making it easier to follow how structure evolves over time and monitor which level may become relevant for the next MSS event. If the chart already contains multiple tools, the markers can be hidden while MSS detection continues in the background.
Flexible MSS Confirmation Logic
MSS confirmation can be evaluated using Close-based or High/Low-based logic.
Close confirmation is stricter and often preferred when cleaner structural breaks matter more than speed. High/Low mode reacts faster as soon as price exceeds the swing level, which can be useful in faster-moving markets.
Same signal concept. Different trade-off.
|
High / Low
|
Close
|
Threshold-Based Validation
Optional threshold validation requires price to move a specified distance beyond the swing level before an MSS event is confirmed.
Threshold values can be measured in ticks, points, or percentage. This can help ignore minor structural breaks and require stronger price commitment before a shift is marked.
|
Without Threshold Validation
|
With Threshold Validation Enabled
|
Alerts & Directional Visual Markers
Bullish and bearish MSS events can be displayed using directional visual markers directly on the chart.
Optional alerts can notify the user when a new MSS event is confirmed. Run the indicator visually, silently, or alongside other tools on the same chart.
Analytical Plot Outputs for Automation
Relevant MSS detection states can be exposed through analytical plot outputs for integration with NinjaTrader strategies and third-party tools such as Strategy Builder, BloodHound, or BlackBird.
MSS logic can be integrated into automated workflows instead of relying only on visual chart interpretation.
How to Interpret and Use the NinjaTrader Market Structure Shift (MSS) Indicator
The following sections explain how the indicator’s visual components and MSS events can be interpreted during live market activity.
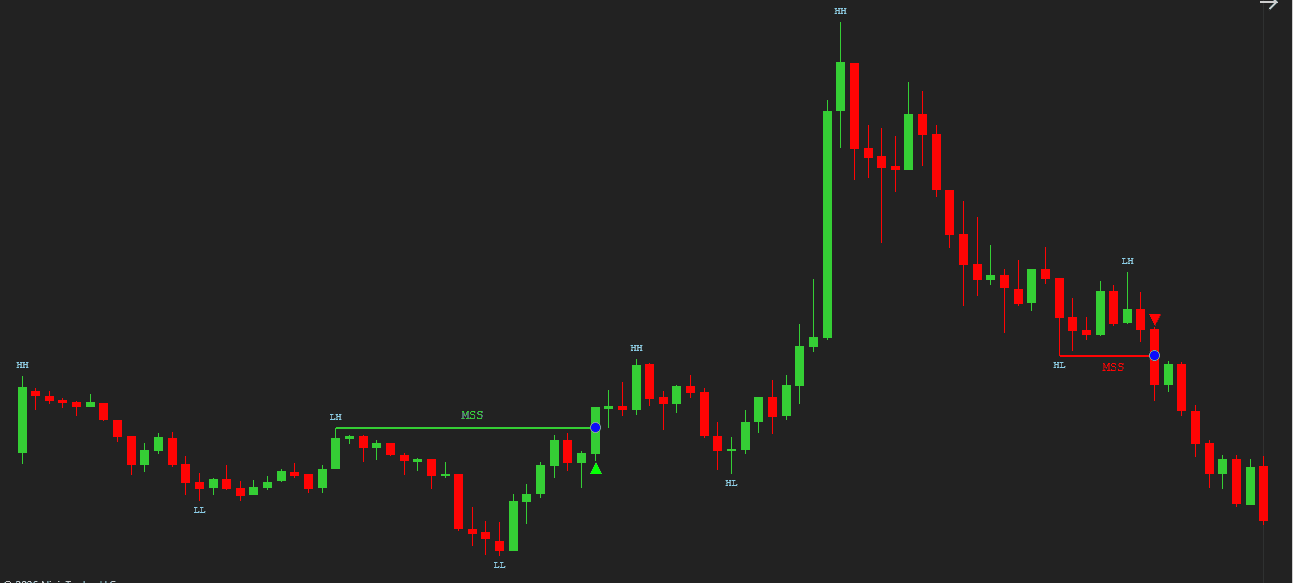
How Bullish and Bearish MSS Events Are Formed
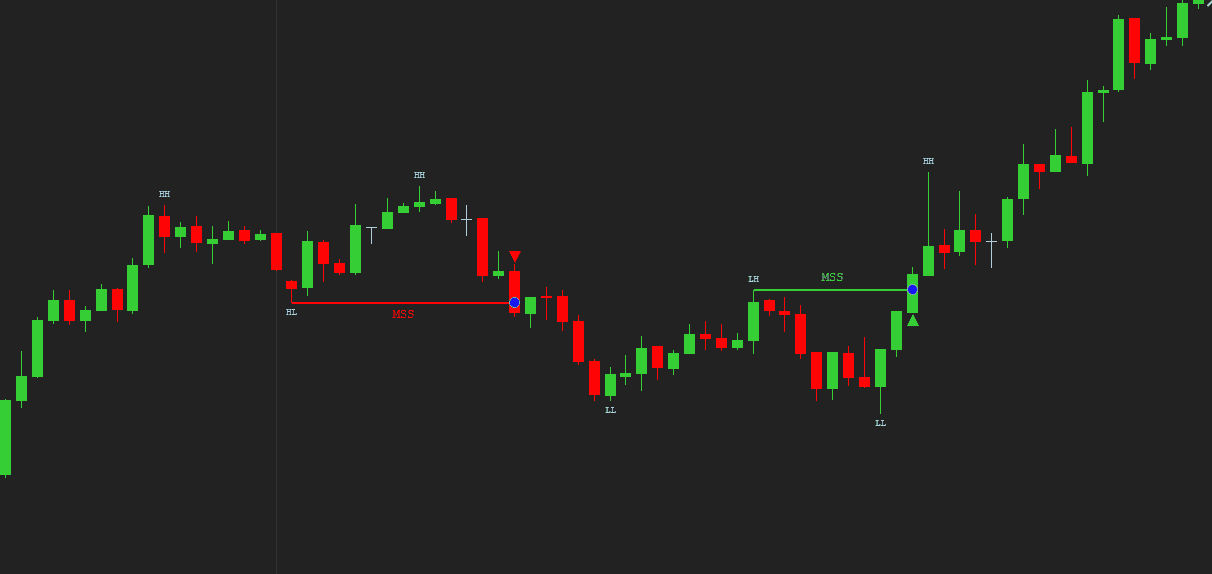
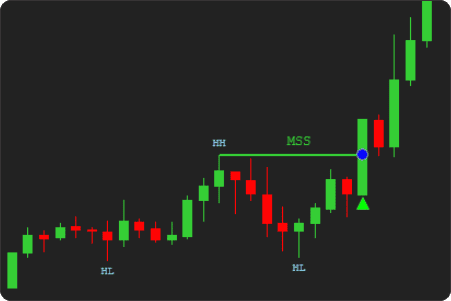
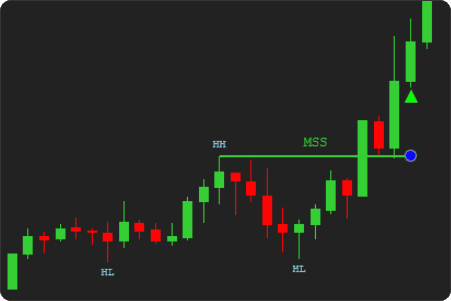
A bullish MSS is triggered when price breaks above the latest confirmed high swing, which may be classified as a Higher High (HH), Lower High (LH), or Equal High (EH). A bullish MSS can occur only if the previous confirmed MSS was not bullish.
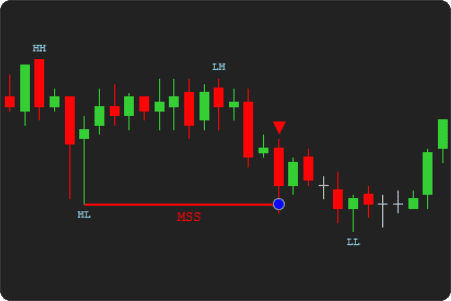
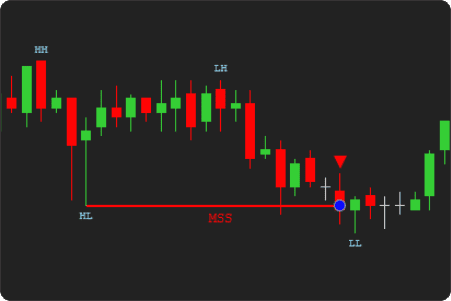
A bearish MSS is triggered when price breaks below the latest confirmed low swing, which may be classified as a Lower Low (LL), Higher Low (HL), or Equal Low (EL). A bearish MSS can occur only if the previous confirmed MSS was not bearish.
These swing classifications are commonly used in Smart Money Concepts (SMC) and price action structure analysis to describe how trends develop and transition.
This filtering logic helps prevent repeated same-direction MSS events and creates a cleaner sequence of alternating structural shift signals on the chart.
Practical Chart Application
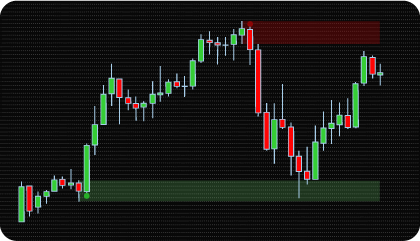
MSS events are most useful when read in context, not in isolation. A common example is monitoring for a bearish MSS after a period of bullish structure, especially when the broken swing high aligns with a previously established resistance level or liquidity zone.
Several ICT and Smart Money Concepts (SMC) tools are commonly paired with MSS for broader structural reading:
Order Blocks — An MSS event forming near an untested order block can add structural context to that area, making the level more relevant than blocks formed during clean trend continuation.
Fair Value Gaps (FVG) — If an MSS occurs and price leaves an unfilled imbalance behind, some traders monitor that gap as a potential area of interest during a retracement.
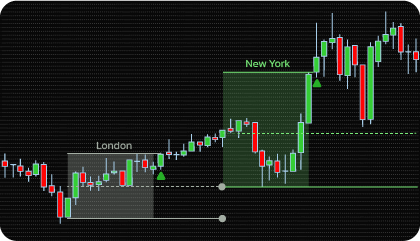
Kill Zones — MSS events developing during higher-activity sessions such as the London open or New York open are often considered more meaningful than shifts forming during quieter periods.
Liquidity Sweeps — A sweep of liquidity followed by an MSS in the opposite direction is one of the more closely watched sequences in ICT methodology, as it may suggest directional movement after liquidity has been taken.
MSS does not need to be used with other tools, but it is frequently applied this way in structure-based chart analysis.
Indicator Settings & Parameters
Swing Detection
Swing Strength
Defines how many surrounding bars are required to confirm a valid swing high or swing low using fractal logic.
Lower values react faster to short-term price movement and produce a more sensitive structure model. Higher values require more developed highs and lows before confirmation, resulting in stricter swing detection and fewer structural shifts.
This setting often has a major influence on how frequently MSS events appear.
MSS Setting
MSS Confirmation Price Type
Determines how price must move beyond the relevant swing level before a Market Structure Shift is confirmed.
- Close — confirmation occurs only when a candle closes beyond the swing level. This is stricter and often cleaner.
- High / Low — confirmation occurs when price extremes exceed the swing level. This reacts faster to intrabar movement.
Same MSS concept. Different trade-off.
Enable Break Confirmation Threshold
Adds an additional distance requirement beyond the swing level before MSS is confirmed.
When enabled, price must move beyond the swing point by the selected threshold amount. This can help ignore minor breaks and require stronger price commitment before a shift is marked.
Threshold Type
Specifies how the threshold distance is measured.
- Ticks — uses the instrument’s minimum price increment.
- Points — uses whole price-point distance.
- Percentage — uses a percentage-based move beyond the swing level.
Threshold Value
Defines the numerical size of the selected threshold requirement.
Example: if Threshold Type is set to Ticks, this value represents the number of ticks price must move beyond the swing level before MSS confirmation.
Bullish MSS Min LH Count
Sets the minimum number of Lower High or Equal High swings required before a bullish MSS is displayed on the chart.
This filter applies only to visual output and alerts. The internal MSS state continues to update regardless of the selected value.
Bearish MSS Min HL Count
Sets the minimum number of Higher Low or Equal Low swings required before a bearish MSS is displayed on the chart.
This filter applies only to visual output and alerts. The internal MSS state continues to update regardless of the selected value.
Signals and Alerts
Enable Buy/Sell Signals
Displays bullish and bearish MSS markers directly on the chart when valid structure shifts are confirmed.
Useful when visual confirmation is preferred during active chart analysis.
Enable Alerts
Generates notifications when a new MSS event is confirmed.
Alerts can be useful when monitoring multiple charts or when visual markers alone may be missed.
Display and Visualization
Show Swing Points
Displays confirmed swing highs and swing lows directly on the chart.
This can make it easier to follow structure development and identify which level may be relevant for the next possible MSS event.
Custom Programming
We can customize this indicator to your needs — adding functions, modifying logic, or integrating it with other tools for your workflow.
We also convert indicators into Automated Trading Strategies with advanced functions (trailing stops, risk management, filters) tailored to your trading style strictly according to your specifications.
Request a free consultation to discuss the technical scope and timeline of your project.
We Value Your Feedback
We are committed to the ongoing development and refinement of our indicators. If you’ve spotted a bug, feel that something essential is missing, or have ideas that could make the indicator even better, just send us a message. Your feedback helps us improve and deliver tools that truly meet traders’ needs.
Exposed Analytical Plots for Strategy Builder Integration
The indicator provides a set of exposed analytical plot outputs designed for structured integration with third-party strategy builders and automation tools such as BloodHound and BlackBird (SharkIndicators), as well as other algorithmic trading environments.
| Analytical Plot Name |
Output Values |
Description |
| Long |
> 0 |
Bullish detection condition. |
| Short |
> 0 |
Bearish detection condition. |
| Swing HH |
Value |
|
| Swing LH |
Value |
|
| Swing EH |
Value |
|
| Swing LL |
Value |
|
| Swing HL |
Value |
|
| Swing EL |
Value |
|
| Bullish MSS |
Value |
|
| Bearish MSS |
Value |
|
Plot output names and descriptions are technical identifiers intended solely for software integration purposes and do not constitute trading advice, signals, or recommendations.
FAQ
1. What does MSS mean in trading?
MSS stands for Market Structure Shift. It describes a structural change where price breaks an opposing swing level, which may suggest that short-term directional control is changing.
The term is widely used in Smart Money Concepts (SMC) and ICT methodologies.
2. How is MSS different from BOS and CHoCH?
These concepts all relate to market structure, but they serve different purposes.
- MSS is commonly used for early directional shifts
- BOS (Break of Structure) is associated with continuation of the active trend
- CHoCH (Change of Character) is often interpreted as a broader reversal signal
This indicator is focused specifically on MSS detection.
3. How does the indicator detect bullish and bearish MSS events?
A bullish MSS is confirmed when price breaks above the latest valid swing high. A bearish MSS is confirmed when price breaks below the latest valid swing low.
Swing levels are determined automatically using fractal structure logic and the selected Swing Strength setting.
4. Does the indicator repaint MSS signals?
No. Once an MSS event is confirmed and plotted on the chart, the signal remains fixed on the bar where confirmation occurred.
Previously confirmed MSS markers are not retroactively moved or rewritten.
5. What does Swing Strength do?
Swing Strength controls how many surrounding bars are required to confirm swing highs and swing lows.
- Lower values react faster to local movement
- Higher values require more developed structure
This setting can significantly affect how frequently MSS events appear.
6. What is the difference between Close confirmation and High/Low confirmation?
Close confirmation requires a candle to close beyond the swing level before MSS is confirmed.
High/Low confirmation reacts as soon as price extremes exceed the level.
Close mode is stricter. High/Low mode is faster.
7. What is Break Confirmation Threshold?
Break Confirmation Threshold requires price to move an additional distance beyond the swing level before MSS is confirmed.
This can help filter minor structural breaks and require stronger price extension before a shift is marked.
8. Can the indicator be used with Strategy Builder or automated systems?
Yes. The indicator includes analytical plot outputs that can be used with NinjaTrader Strategy Builder and other compatible automation tools.
This allows MSS logic to be incorporated into systematic workflows.
9. Can MSS be used for scalping or is it better for swing trading?
MSS logic can be applied to both short-term and higher-timeframe charts.
- Scalping / intraday trading: lower Swing Strength settings may react faster to local structure shifts.
- Swing trading / higher timeframes: higher Swing Strength settings can focus on broader structural moves.
The preferred setup usually depends on timeframe, instrument volatility, and how much structure detail is desired.
10. How is this MSS indicator different from other MSS indicators for NinjaTrader?
This indicator is built as a dedicated MSS-only tool rather than a multi-signal package combining BOS, CHoCH, and other overlays.
Key differences include:
- focused MSS detection with cleaner chart output
- repeated same-direction signal filtering
- selectable Close or High/Low confirmation logic
- optional threshold validation
- swing point visualization
- analytical plot outputs for automation workflows
The result is a more specialized workflow for traders who want MSS structure shifts without unnecessary chart clutter.
Disclaimer — Software Use & Risk Disclosure
Nordman Algorithms is a trade name of Nordman Algorithms OÜ (Reg. No. 14435535), registered in Tallinn, Estonia.
Software Nature & User Responsibility — Nordman Algorithms provides algorithmic software tools for technical analysis. Nordman Algorithms is not a financial advisor and is not liable for any losses. All trades conducted based on the software’s output are executed at the user’s sole discretion and risk.
Visual Markers & Signal Disclosure — This software may display visual markers (such as arrows, dots, or alerts) when predefined mathematical conditions are met. These markers are provided for educational and analytical purposes only, must not be interpreted as financial guidance, and do not constitute a recommendation to buy, sell, or hold any financial instrument. Users must independently validate all visual cues within their own trading methodology.
No Financial Advice — Nordman Algorithms does not provide discretionary trading signals, investment advice, or managed signal services. Our software represents a mathematical visualization of historical and real-time data. The appearance of a visual marker does not guarantee a profitable trade or predict future market behavior.
Trading Risk Warning — Futures, Forex, and options trading involve significant risk. Risk capital is money that can be lost without jeopardizing financial security. Only risk capital should be used for trading. Past performance is not indicative of future results. View Full Risk Disclosure: https://www.nordman-algorithms.com/risk-disclosure/
ESMA Risk Warning — Financial instruments, especially those involving leverage such as CFDs and Forex, are complex and carry a high risk of rapid financial loss. Our software provides analytical outputs and visual markers based on predefined mathematical conditions and does not mitigate or reduce inherent market risks. You should carefully consider whether you understand how leveraged financial instruments work and whether you can afford the high risk of losing your capital.
CFTC Rule 4.41 — Hypothetical or simulated performance results have inherent limitations. Unlike actual performance records, simulated results do not represent real trading. Because trades have not actually been executed, these results may under- or over-compensate for the impact of market factors such as liquidity. No representation is being made that any account will achieve profits or losses similar to those shown.
Trademark Notice — NinjaTrader® is a registered trademark of NinjaTrader Group, LLC. No NinjaTrader company has any affiliation with the owner, developer, or provider of the products or services described herein, or any interest, ownership or otherwise, in any such product or service, or endorses, recommends or approves any such product or service.