NinjaTrader Advanced Opening Range Indicator — Overview
Opening Range Breakout Concept Explained
The Opening Range Breakout (ORB) approach is based on the idea that the early portion of a trading session often forms a price range reflecting initial market activity and volatility. This Opening Range is defined using a fixed time window after the session begins, where the highest and lowest prices establish session boundaries that remain visible throughout the session.
When price moves beyond these boundaries, it represents directional expansion relative to the initial session balance. These movements are referred to as breakouts, occurring when price exceeds the range high or falls below the range low. Because the opening range captures the earliest phase of session activity, its boundaries often act as reference levels during intraday analysis.
The Opening Range itself can be constructed using different methods. Some approaches measure the full high–low span of the interval, while others rely on candle body values or volatility-based calculations. In each case, the goal is to define a clear price zone from which directional price movement can be evaluated.
In practical chart analysis, opening range levels are monitored during a defined trade entry window after the range has formed. Breakouts occurring within this period can be evaluated using confirmation rules such as price closes beyond the range boundary, threshold validation, or contextual filters based on volatility, volume, or higher-timeframe trend conditions.
The NinjaTrader Advanced Opening Range Indicator automates the construction of the opening range, monitors breakout conditions within the defined trading window, and visualizes these events on the chart using visual markers and alerts.
NinjaTrader Advanced Opening Range Indicator — Key Features
Configurable Opening Range Construction
The indicator defines the opening range using user-specified session times, allowing the interval to align with a specific trading session. During this period, it calculates the range boundaries and plots the corresponding high and low reference levels directly on the chart.
Multiple range construction methods are supported: the full high–low span, candle body range (open–close), or a volatility-based ATR model. These options allow the opening range to be adapted to different market conditions while maintaining a consistent breakout reference framework.
|
Full Range
|
Body Range
|
ATR-based Range
|
Breakout Confirmation Modes
Breakout events are evaluated relative to the established opening range boundaries. The indicator provides selectable confirmation logic that defines how breakout conditions are recognized once price moves beyond the range.
Confirmation can be based on price extremes (High / Low) or candle closing values, allowing breakout detection to align with different analytical approaches to session range expansion.
|
High / Low
|
Close
|
Threshold Validation System
The indicator includes an optional threshold validation mechanism that works alongside breakout confirmation. When enabled, price must reach a predefined distance beyond the opening range boundary before the breakout is confirmed.
Threshold values can be defined using tick-based or percentage-based measurements. An optional confirmation window can also be specified, allowing the threshold condition to be evaluated across a defined number of bars following the initial price extension.
|
Without Threshold Validation
|
With Threshold Validation Enabled
|
Multi-Layer Validation Filters
Additional validation filters can be applied to breakout events through a flexible set of filter conditions. When enabled, these filters require specific contextual criteria to be satisfied before visual markers are displayed.
Available filters include volume conditions (average volume and minimum volume thresholds), ATR-based volatility checks, EMA alignment, higher-timeframe trend validation, and ADX-based directional strength. Each filter can be enabled independently.
Minimum Volume Filter Enabled
Target & Stop Level Projections
The tool can optionally display target and stop levels associated with detected directional moves. These levels appear on the chart as visual guides derived from fixed distances, ATR-based calculations, or values based on the size of the Opening Range.
When enabled, these levels are plotted automatically after a breakout is detected and extend forward on the chart from the breakout point.
Alerts & Visual Markers
Breakout events are displayed on the chart using directional visual markers that appear when selected breakout conditions are met. These markers indicate bullish or bearish range expansion relative to the Opening Range boundaries.
Configurable alerts can be generated for breakout events as well as for target and stop level interactions. Each alert type can be enabled or disabled independently.
Breakout conditions are also exposed through analytical plot outputs, allowing the indicator to be integrated with NinjaTrader strategies and automated systems.
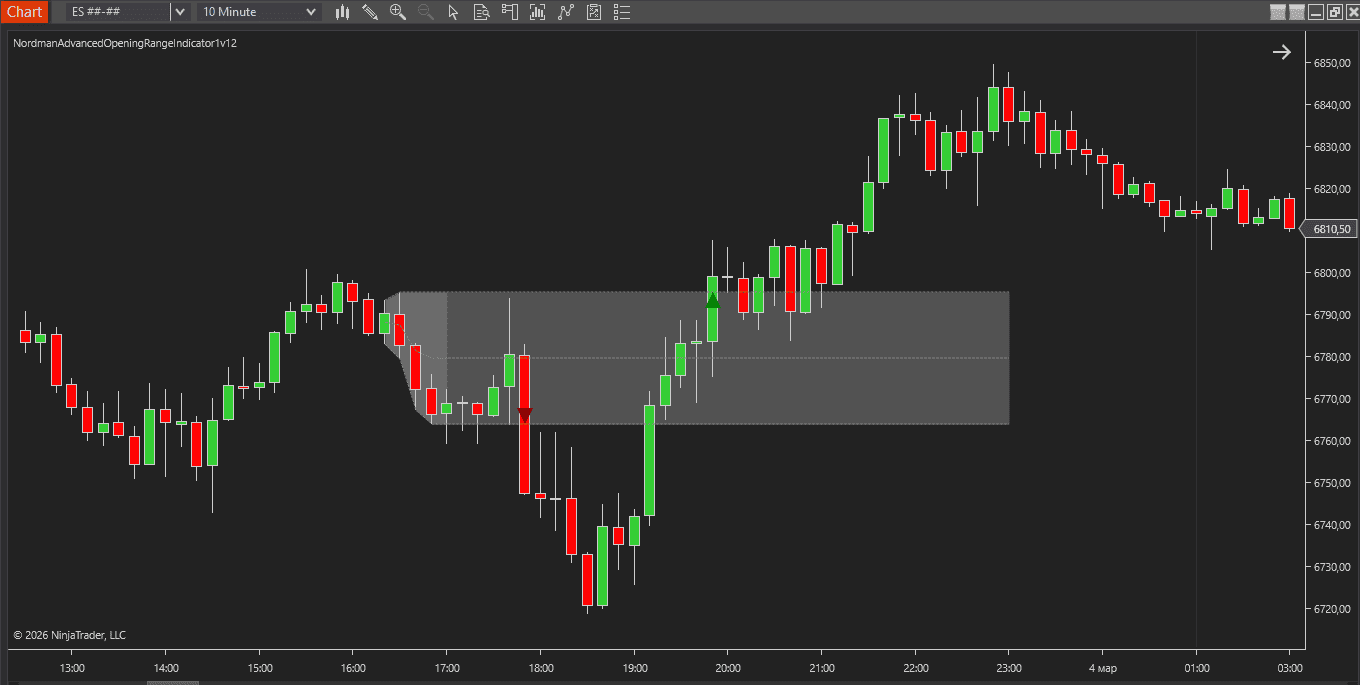
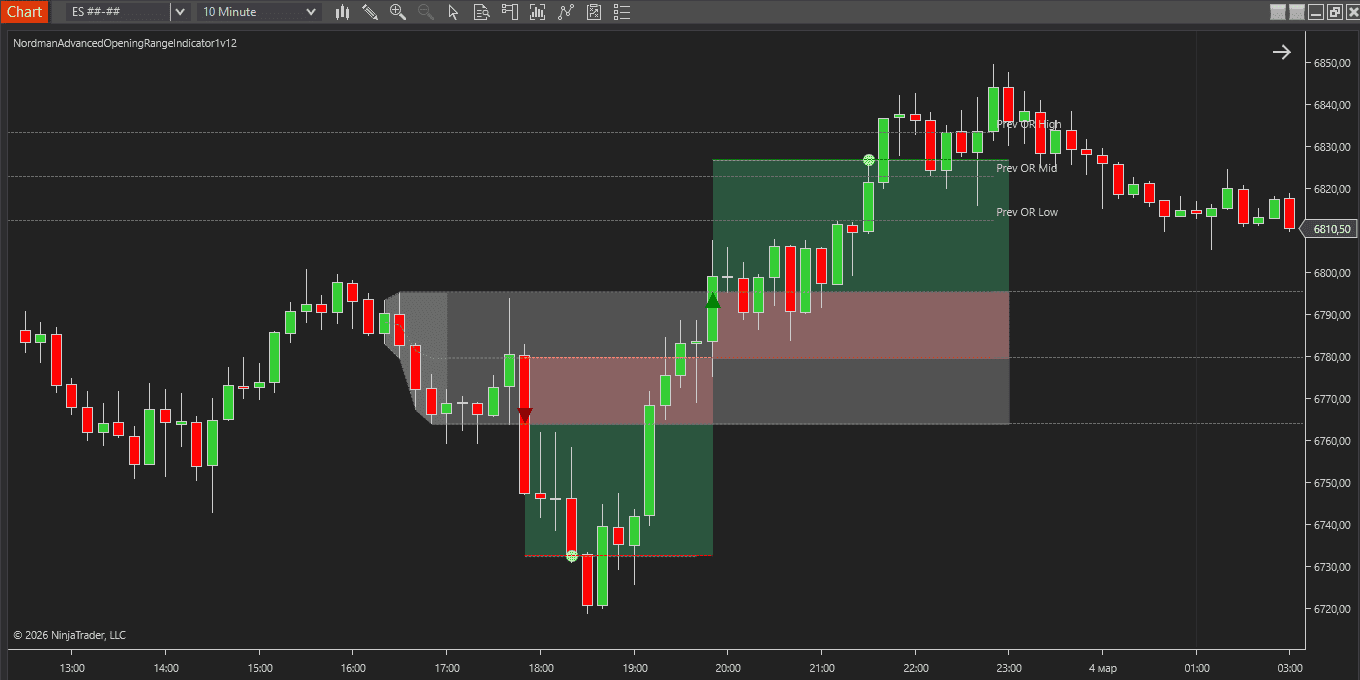
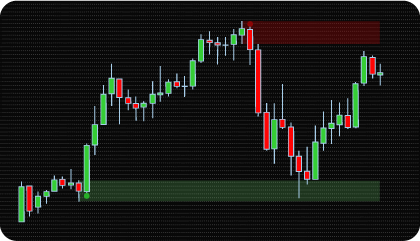
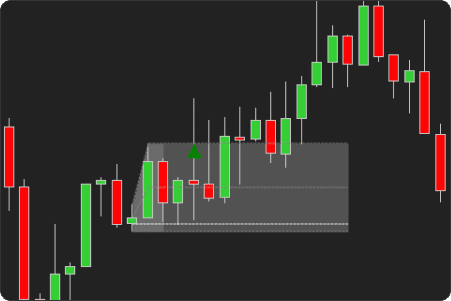
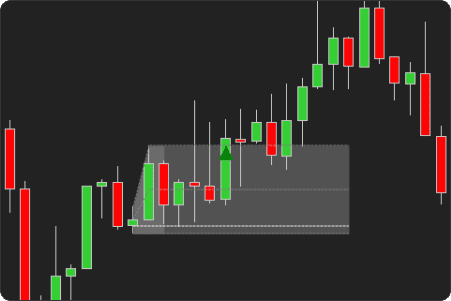
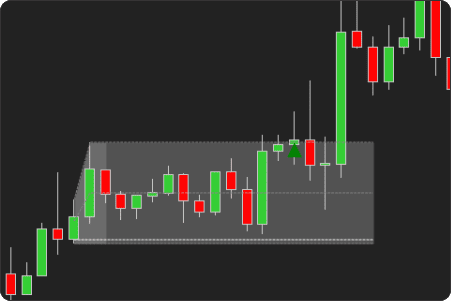
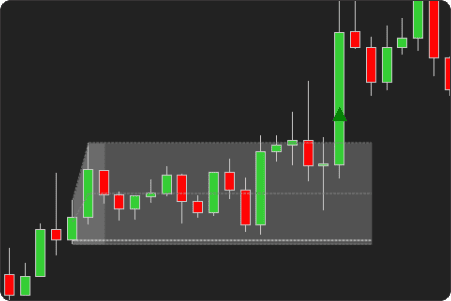
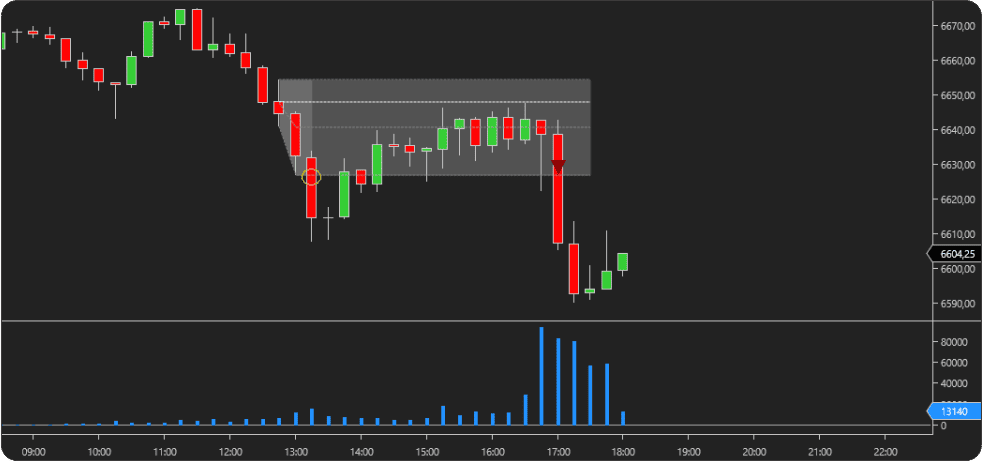
Previous Day Opening Range Display
The tool can display the Opening Range from the previous trading session alongside the current session’s range. This visual reference can provide additional context when traders compare current session price behavior with the prior day’s Opening Range.
How to Interpret and Use the NinjaTrader Advanced Opening Range Breakout Indicator
The following sections explain how the indicator’s visual components and events can be interpreted during an active trading session.
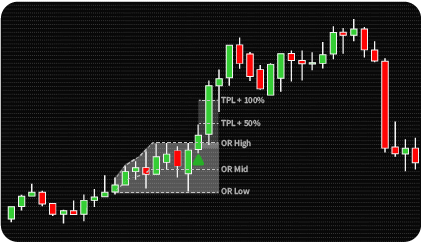
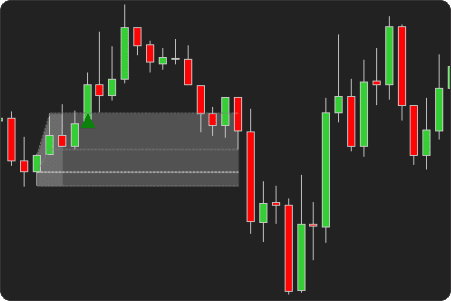
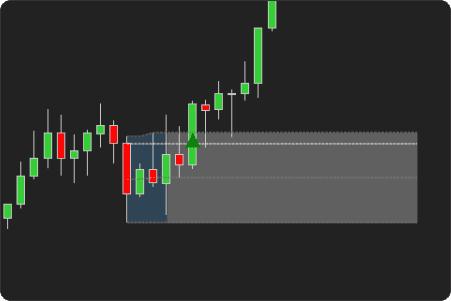
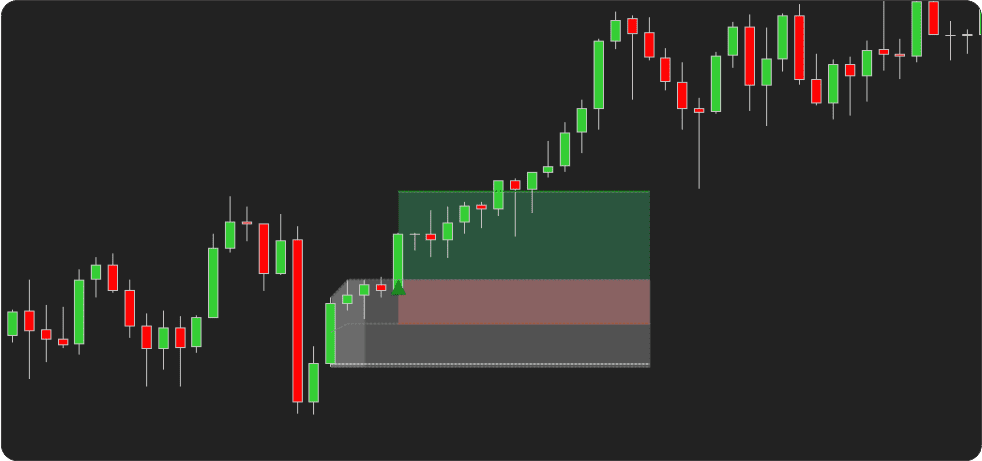
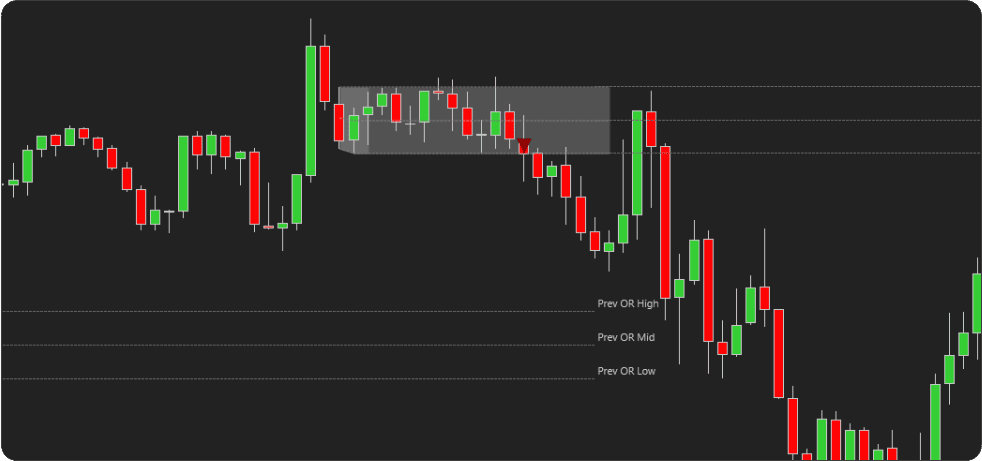
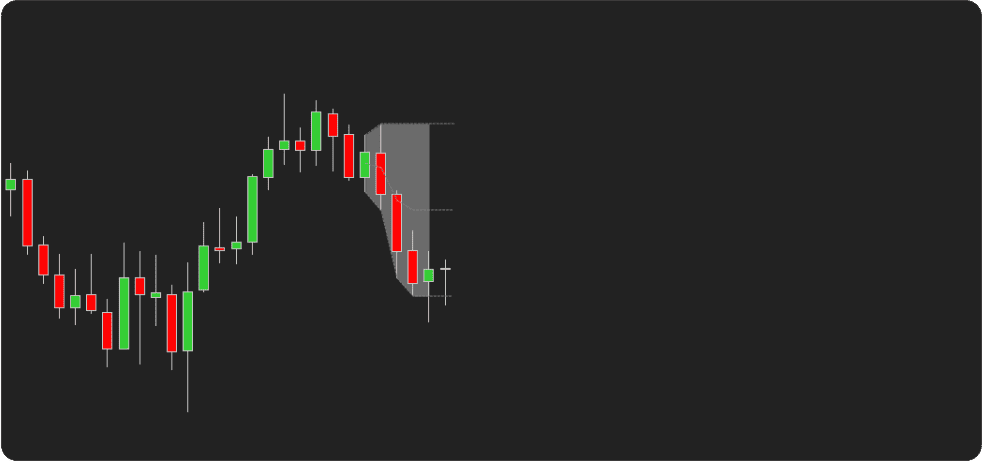
Opening Range Structure
At the start of the session, the indicator constructs the Opening Range using the configured start and end times. During this period, the range boundaries are determined by the selected range type, which may be based on the full High–Low span of the interval, the candle body range (Open–Close), or a volatility-based model derived from ATR.
Once the range interval is complete, the upper and lower session levels remain plotted on the chart. These levels represent the initial balance against which subsequent price movement is evaluated.
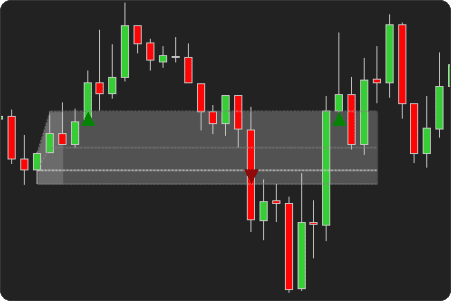
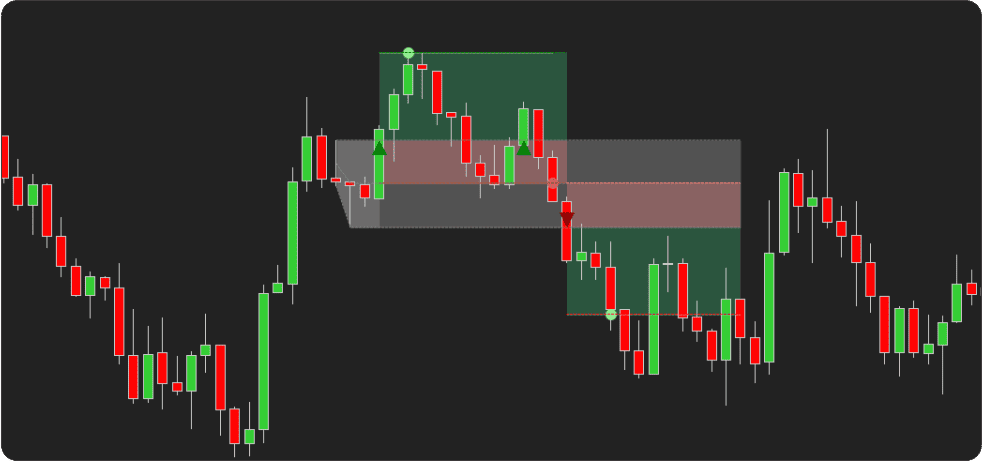
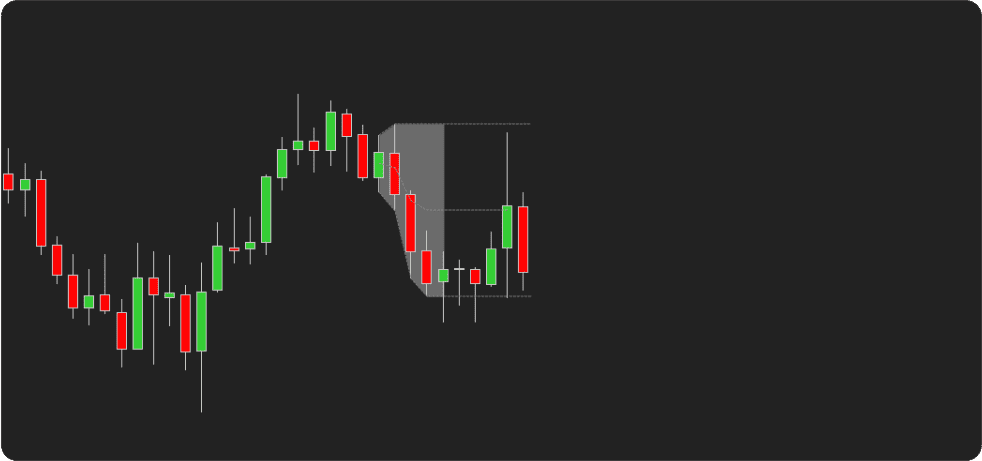
Trade Entry Window
After the opening range is established, the indicator begins monitoring price activity within the configured Trade Entry Window. Breakout detection is only evaluated during this period.
If price moves beyond the range boundaries during the defined window and the selected confirmation conditions are satisfied, the indicator registers a breakout event and displays the corresponding visual marker.
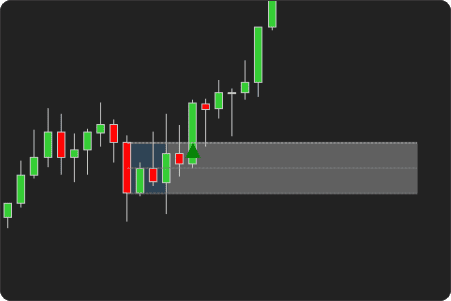
Breakout Detection and Visual Markers
Breakout events are displayed on the chart using visual markers that appear when the breakout conditions defined in the indicator settings are met.
A bullish marker appears when price confirms a move above the opening range high according to the selected confirmation method.
A bearish marker appears when price confirms a move below the opening range low.
Depending on the selected signal mode, markers can appear for every qualifying breakout, only for the first breakout of the session, or once per directional breakout.
Breakout Confirmation Logic
Confirmation can be evaluated using price extremes (High / Low) or candle closing values. This allows the confirmation logic to align with different interpretations of range expansion during the session.
If Threshold Validation is enabled, price must move a specified distance beyond the opening range boundary before the breakout condition is confirmed. An optional confirmation window allows the threshold condition to be satisfied within a defined number of bars after the initial breakout.
Filter-Based Breakout Conditions
Additional validation filters can be applied to breakout events through selected filter conditions.
Available filters include volume-based conditions (average volume and minimum volume thresholds), ATR-based volatility checks, EMA alignment filters, higher-timeframe trend validation, and directional strength checks using ADX.
When these filters are enabled, visual markers appear only after the validation conditions are satisfied.
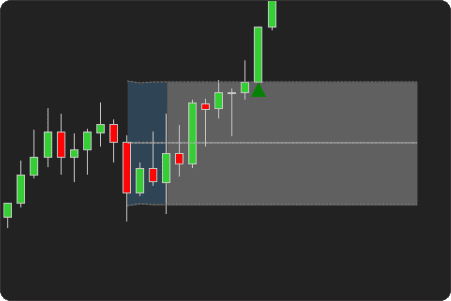
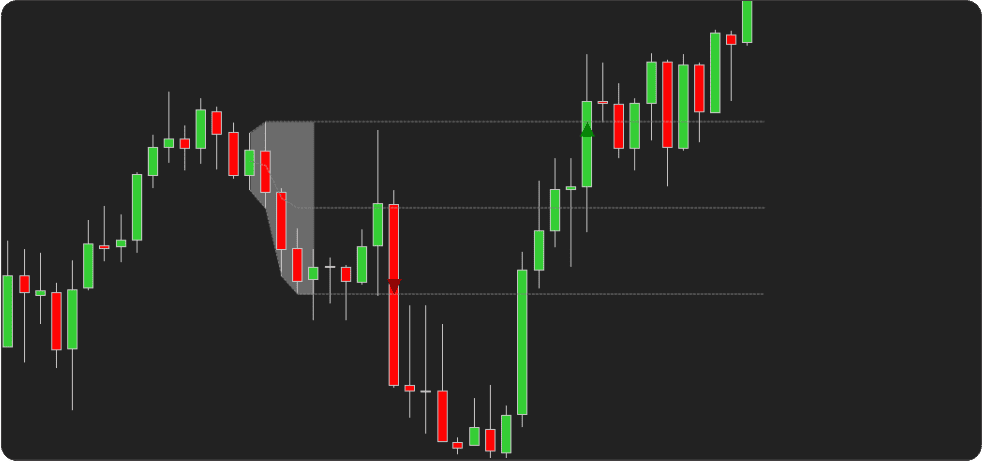
Target and Stop Level Interpretation
If enabled, the tool automatically plots target and stop levels when a breakout event is detected.
These levels extend forward from the breakout point on the chart and are calculated using the selected method, which may include fixed distances, ATR-based measurements, or values derived from the opening range size.
Indicator Settings & Parameters
Opening Range Configuration
Opening Range Start Time and Opening Range End Time establish the interval used to construct the Opening Range.
Trade Entry Start Time and Trade Entry End Time specify the time window during which breakout detection is evaluated.
Range Type
The Opening Range can be constructed using several calculation methods depending on how early session price activity is interpreted.
- Full Range — uses the complete High–Low span of the interval.
- Body Range — uses candle body values (Open–Close).
- ATR-based Range — constructs the range using a volatility model derived from Average True Range.
When the ATR-based method is used, ATR Source selects the price input used for ATR calculations (Open or High/Low values).
Previous Session Range
Show Previous Day Opening Range displays the previous session’s Opening Range alongside the current session range, allowing comparison between the current session structure and the prior session’s initial balance.
Breakout Detection Settings
Breakout Confirmation Mode
Specifies how price must move beyond the range boundary before a breakout is confirmed.
- High / Low — confirmation occurs when price extremes exceed the range boundary.
- Close — confirmation occurs only when a candle closes beyond the range boundary.
Signal Mode
Determines how frequently breakout markers can appear during the session.
- All Breakouts (Continuous) — markers appear for every qualifying breakout.
- First Breakout Only — only the first breakout of the session is marked.
- One Breakout Per Direction — one bullish and one bearish breakout are allowed per session.
Threshold Validation
Threshold Validation requires price to move a specified distance beyond the Opening Range boundary before a breakout is confirmed.
The threshold distance can be measured using:
An optional Threshold Confirmation Window allows the required distance to be reached within a specified number of bars following the initial range extension.
Validation Filters
Optional validation filters can require additional contextual conditions to be satisfied before breakout markers are displayed.
Volume Filters
- Volume MA Check: compares the current volume with the average volume over a selected period.
- Average Volume Multiplier: specifies how much larger the current volume must be relative to the average volume.
- Minimum Volume Check: requires the current bar volume to exceed a specified minimum value.
Volatility and Trend Filters
- ATR Filter: validates breakouts using volatility conditions derived from ATR.
- EMA Filter: evaluates directional alignment relative to a selected exponential moving average.
- ADX Filter: evaluates directional strength using ADX values.
Higher-Timeframe Trend Filter
The HTF Trend filter evaluates directional alignment using a higher timeframe.
- Higher Timeframe Type: selects the timeframe used for analysis.
- HTF EMA Period: defines the EMA period used to evaluate trend direction.
Filter Confirmation Window: When validation filters are enabled, this specifies how many bars the indicator waits for filter conditions to be satisfied after the initial breakout.
Max Breakout Distance: Acts as a safety constraint. If price moves too far from the Opening Range boundary before the filter conditions are satisfied, the breakout signal is ignored.
Target and Stop Level Settings
The indicator can project target and stop levels associated with detected breakout events. These levels extend forward from the breakout point and serve as reference levels for trade management.
Target Levels
When Enable TP is activated, target levels can be calculated using:
- Fixed Distance
- ATR Based
- Range Multiplier, derived from the Opening Range size
Optional alerts and markers can be triggered when the target level is reached. An intermediate 50% Target Level may also be displayed.
Stop Levels
When Enable SL is activated, stop levels can be calculated using:
- Fixed Distance
- ATR Based
- Range Percent Level, derived from the Opening Range size
Optional alerts and markers can be triggered when the stop level is reached. An intermediate 50% Stop Level may also be displayed.
Custom Programming
We can customize this indicator to your needs — adding functions, modifying logic, or integrating it with other tools for your workflow.
We also convert indicators into Automated Trading Strategies with advanced functions (trailing stops, risk management, filters) tailored to your trading style strictly according to your specifications.
Request a free consultation to discuss the technical scope and timeline of your project.
We Value Your Feedback
We are committed to the ongoing development and refinement of our indicators. If you’ve spotted a bug, feel that something essential is missing, or have ideas that could make the indicator even better, just send us a message. Your feedback helps us improve and deliver tools that truly meet traders’ needs.
Exposed Analytical Plots for Strategy Builder Integration
The indicator provides a set of exposed analytical plot outputs designed for structured integration with third-party strategy builders and automation tools such as BloodHound and BlackBird (SharkIndicators), as well as other algorithmic trading environments.
| Analytical Plot Name |
Output Values |
Description |
| Open Level |
Value |
|
| High Level |
Value |
|
| Low Level |
Value |
|
| Mid Level |
Value |
|
| Long 50% TP |
Value |
|
| Short 50% TP |
Value |
|
| Long TP |
Value |
|
| Short TP |
Value |
|
| Long |
> 0 |
Bullish breakout detection condition. |
| Short |
> 0 |
Bearish breakout detection condition. |
| Long 50% TP Signal |
> 0 |
Triggers when price reaches the Long 50% TP level. |
| Short 50% TP Signal |
> 0 |
Triggers when price reaches the Short 50% TP level. |
| Long TP Signal |
> 0 |
Triggers when price reaches the primary Long TP level. |
| Short TP Signal |
> 0 |
Triggers when price reaches the primary Short TP level. |
| Long 50% SL |
Value |
|
| Short 50% SL |
Value |
|
| Long SL |
Value |
|
| Short SL |
Value |
|
| Long 50% SL Signal |
> 0 |
Triggers when price reaches the Long 50% SL level. |
| Short 50% SL Signal |
> 0 |
Triggers when price reaches the Short 50% SL level. |
| Long SL Signal |
> 0 |
Triggers when price reaches the primary Long SL level. |
| Short SL Signal |
> 0 |
Triggers when price reaches the primary Short SL level. |
| Prev OR Open |
Value |
|
| Prev OR High |
Value |
|
| Prev OR Low |
Value |
|
| Prev OR Mid |
Value |
|
| Within Open Range Time |
Value |
|
| Within Trade Time |
Value |
|
Plot output names and descriptions are technical identifiers intended solely for software integration purposes and do not constitute trading advice, signals, or recommendations.
FAQ
1. Is the NinjaTrader Advanced Opening Range Indicator compatible with NinjaTrader 8?
Yes. If you are looking for a professional Opening Range Breakout indicator for NinjaTrader 8, this tool is designed specifically for the NT8 platform. It integrates directly with NinjaTrader charts and works with the platform’s native data feeds and chart types.
2. Does the indicator work on all instrument types such as futures, forex, and stocks?
Yes. The indicator can be used on any instrument supported by NinjaTrader, including:
- futures contracts
- forex pairs
- stocks and ETFs
Because the Opening Range is calculated from session time and price movement, the tool can adapt to different markets and trading environments.
3. Can the indicator be used with NinjaTrader Strategy Builder or automation platforms such as BloodHound and BlackBird?
Yes. The indicator can be integrated with automation tools such as NinjaTrader Strategy Builder, BloodHound, and BlackBird. It exposes internal analytical plot outputs that represent detection conditions. These plots can be referenced in automated strategy logic or visual strategy builders.
4. Does the indicator generate alerts for breakout events in NinjaTrader?
Yes. The indicator can generate alerts when breakout conditions or level interactions occur. Alerts can be triggered for:
- breakout detection events
- target level interactions
- stop level interactions
Each alert type can be enabled or disabled independently in the indicator settings.
5. How is this indicator different from a standard NinjaTrader session range tool?
Standard session range tools typically display only session highs and lows. The NinjaTrader Advanced Opening Range Indicator goes further by providing:
- automated breakout detection
- configurable confirmation logic
- validation filters
- projected target and stop levels
Unlike basic drawing tools, the indicator includes structured logic that can also be used in systematic or automated trading workflows.
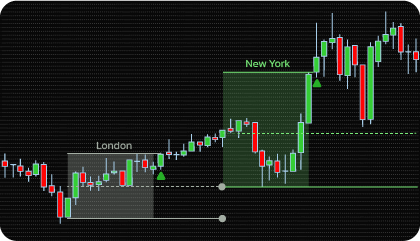
6. Can the Opening Range time window be customized in the indicator?
Yes. The Opening Range interval can be defined using user-specified start and end times. This allows the range to align with different trading sessions such as:
- US market open
- London session
- custom intraday session windows.
7. What range calculation methods are available and how do Full Range, Body Range, and ATR-based ranges differ?
The indicator supports several range construction methods:
- Full Range — uses the highest and lowest prices observed during the interval
- Body Range — calculates the range using candle body values (Open–Close)
- ATR-based Range — derives the range from volatility using Average True Range (ATR)
Each method represents a different way of interpreting early session price activity.
8. What is the advantage of using an ATR-based Opening Range instead of a traditional High-Low range?
ATR-based range construction uses volatility measurements rather than relying strictly on price extremes. This allows the range to reflect broader market volatility conditions rather than only the highest and lowest prices observed during the session interval.
9. How does breakout confirmation work in the indicator?
Breakout confirmation determines when price movement beyond the Opening Range boundaries is recognized as a valid breakout. Confirmation can be evaluated using:
- price extremes (High / Low)
- candle closing values
These options allow breakout detection to align with different analytical interpretations of range expansion.
10. What is the difference between High/Low confirmation and Close-based breakout confirmation?
High/Low confirmation detects a breakout when the price extreme moves beyond the range boundary during a bar. Close-based confirmation requires the candle to close beyond the range boundary before the breakout is confirmed. These two methods represent different approaches to evaluating directional price extension.
11. Why might the indicator not display a breakout marker even if price moves beyond the range boundaries?
A breakout marker may not appear if additional validation conditions are active. For example, breakout detection may require:
- volume conditions
- ATR volatility thresholds
- EMA directional alignment
- higher-timeframe trend confirmation
- threshold validation distance
If these conditions are not satisfied, the breakout event will not be confirmed.
12. Does the indicator repaint breakout markers?
No. Once a breakout marker is confirmed and plotted on the chart, it remains fixed at the bar where the breakout conditions were satisfied. The indicator does not retroactively modify previously confirmed breakout markers.
13. What validation filters can be applied to Opening Range breakout detection?
The indicator includes several optional filters that can be used to validate breakout events. Available filters include:
- volume conditions
- ATR-based volatility checks
- EMA alignment filters
- higher-timeframe trend validation
- ADX directional strength checks.
These filters allow breakout events to be evaluated within broader market conditions.
14. How do volume filters affect breakout detection during the opening session?
Volume filters evaluate trading activity relative to historical volume levels. For example, breakout markers may require volume to exceed an average volume threshold or a minimum volume level. This allows breakout detection to consider market activity during the session.
15. What is the role of ATR, EMA, ADX, and higher-timeframe trend filters in breakout analysis?
These filters provide additional analytical context when evaluating breakout events. ATR evaluates volatility conditions, EMA filters evaluate directional alignment, ADX evaluates directional strength, and Higher-timeframe trend filters compare the breakout direction with broader market structure. Each filter can be enabled independently.
16. Can multiple validation filters be used at the same time?
Yes. Multiple filters can be active simultaneously. When several filters are enabled, breakout markers are displayed only when all selected validation conditions are satisfied.
17. How does threshold validation work in Opening Range breakout detection?
Threshold validation requires price to move a specified distance beyond the Opening Range boundary before a breakout is confirmed. This distance can be defined using ticks or percentage of price. The threshold condition can also be evaluated within a defined number of bars using the Threshold Confirmation Window.
18. How are target and stop levels calculated from the Opening Range after a breakout event?
Target and stop levels can be projected using several calculation methods. These may include fixed price distances, ATR-based measurements, or values derived from the size of the Opening Range. Once calculated, these levels extend forward from the breakout point and appear on the chart as projected reference levels.
Disclaimer — Software Use & Risk Disclosure
Nordman Algorithms is a trade name of Nordman Algorithms OÜ (Reg. No. 14435535), registered in Tallinn, Estonia.
Software Nature & User Responsibility — Nordman Algorithms provides algorithmic software tools for technical analysis. Nordman Algorithms is not a financial advisor and is not liable for any losses. All trades conducted based on the software’s output are executed at the user’s sole discretion and risk.
Visual Markers & Signal Disclosure — This software may display visual markers (such as arrows, dots, or alerts) when predefined mathematical conditions are met. These markers are provided for educational and analytical purposes only, must not be interpreted as financial guidance, and do not constitute a recommendation to buy, sell, or hold any financial instrument. Users must independently validate all visual cues within their own trading methodology.
No Financial Advice — Nordman Algorithms does not provide discretionary trading signals, investment advice, or managed signal services. Our software represents a mathematical visualization of historical and real-time data. The appearance of a visual marker does not guarantee a profitable trade or predict future market behavior.
Trading Risk Warning — Futures, Forex, and options trading involve significant risk. Risk capital is money that can be lost without jeopardizing financial security. Only risk capital should be used for trading. Past performance is not indicative of future results. View Full Risk Disclosure: https://www.nordman-algorithms.com/risk-disclosure/
ESMA Risk Warning — Financial instruments, especially those involving leverage such as CFDs and Forex, are complex and carry a high risk of rapid financial loss. Our software provides analytical outputs and visual markers based on predefined mathematical conditions and does not mitigate or reduce inherent market risks. You should carefully consider whether you understand how leveraged financial instruments work and whether you can afford the high risk of losing your capital.
CFTC Rule 4.41 — Hypothetical or simulated performance results have inherent limitations. Unlike actual performance records, simulated results do not represent real trading. Because trades have not actually been executed, these results may under- or over-compensate for the impact of market factors such as liquidity. No representation is being made that any account will achieve profits or losses similar to those shown.
Trademark Notice — NinjaTrader® is a registered trademark of NinjaTrader Group, LLC. No NinjaTrader company has any affiliation with the owner, developer, or provider of the products or services described herein, or any interest, ownership or otherwise, in any such product or service, or endorses, recommends or approves any such product or service.