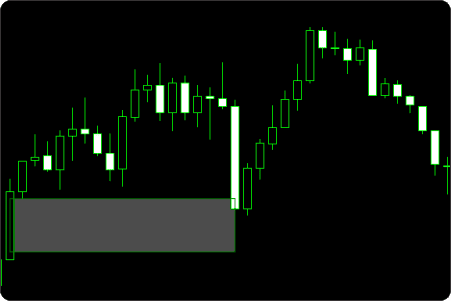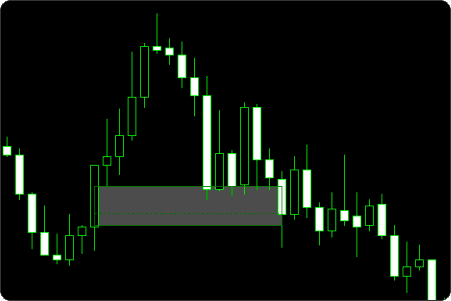
A Fair Value Gap (FVG) refers to a price imbalance where the market moves aggressively enough to leave a gap between candles, creating an area with limited two-sided trading. In practical terms, this often reflects fast directional movement where buy and sell orders were not fully matched before price continued higher or lower.
The concept is widely used in ICT (Inner Circle Trader) and Smart Money Concepts (SMC) methodologies as a way to identify areas where price may later revisit in order to rebalance inefficient movement.
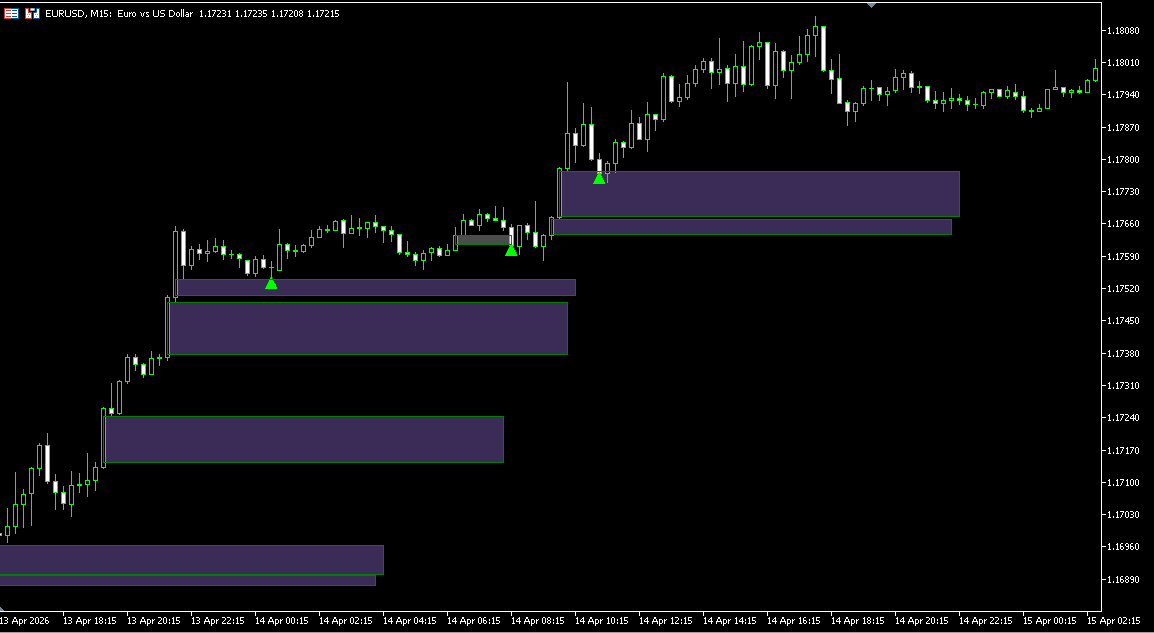
Bullish Fair Value Gaps form during strong upward displacement, while bearish Fair Value Gaps form during strong downward displacement. Once created, these zones are often monitored as future reaction areas when price retraces back into the imbalance.
Not every gap has equal relevance. Size, duration, market context, and how price interacts with the zone later all matter. Some gaps are revisited quickly and filled, while others remain open for extended periods and continue to act as reference levels.
The MT5 Fair Value Gap Indicator automates this process by detecting FVG zones, tracking whether they remain active, become mitigated, or expire over time, and visualizing these states directly on the chart for structured analysis.
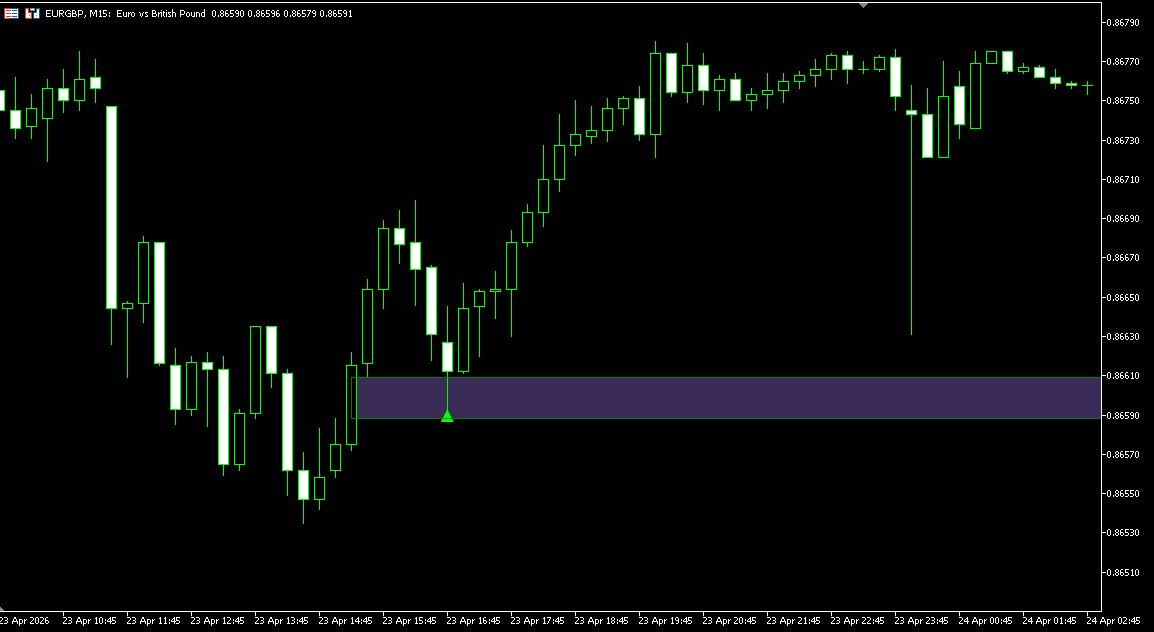
The indicator automatically detects both Bullish and Bearish Fair Value Gaps and plots them directly on the chart as structured imbalance zones.
Detection can be refined through directional filters, allowing traders to display only bullish gaps, only bearish gaps, or both. This is useful when aligning chart analysis with broader directional bias.
Minimum gap size filters are available in ticks, points, or percentage, helping remove minor inefficiencies that may be less relevant in active market conditions.
A configurable history bars limit controls how much historical data is scanned.
FVG Min Length (bars) defines the minimum horizontal lifespan of a newly created zone. This helps prevent gaps from appearing and disappearing too quickly, giving traders enough chart time to evaluate whether price reacts, returns, or leaves the imbalance untouched.
This keeps attention on imbalances that meet your size, direction, and visibility rules.
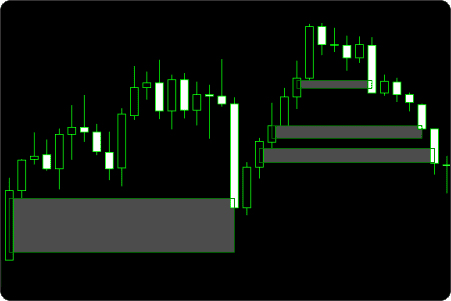
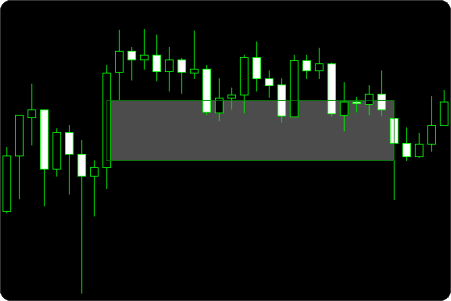
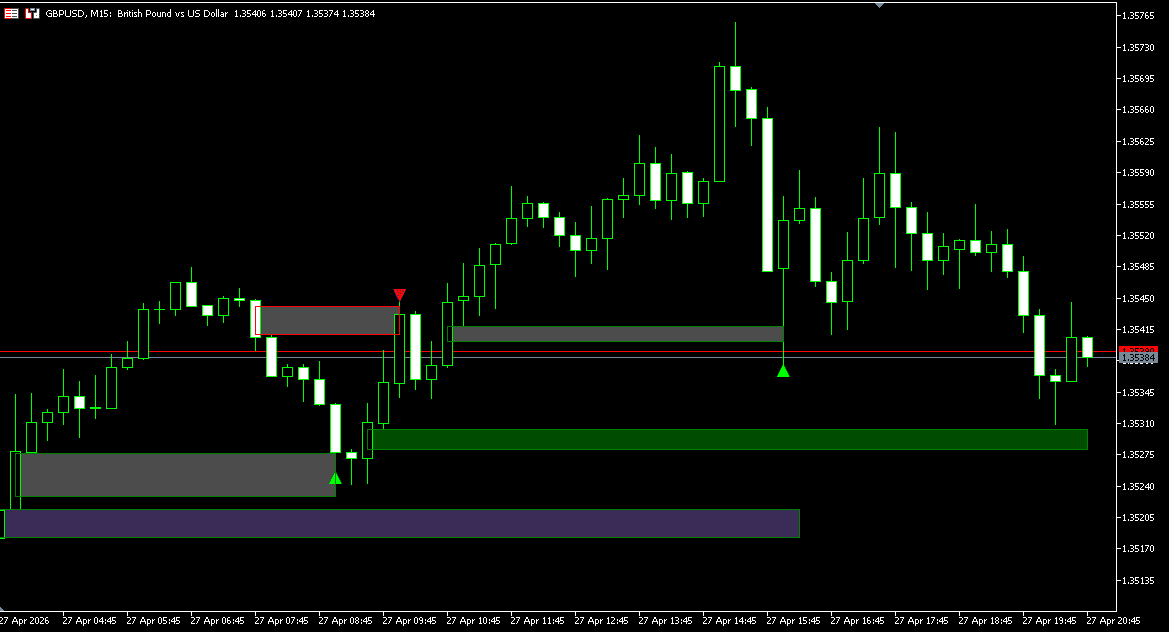
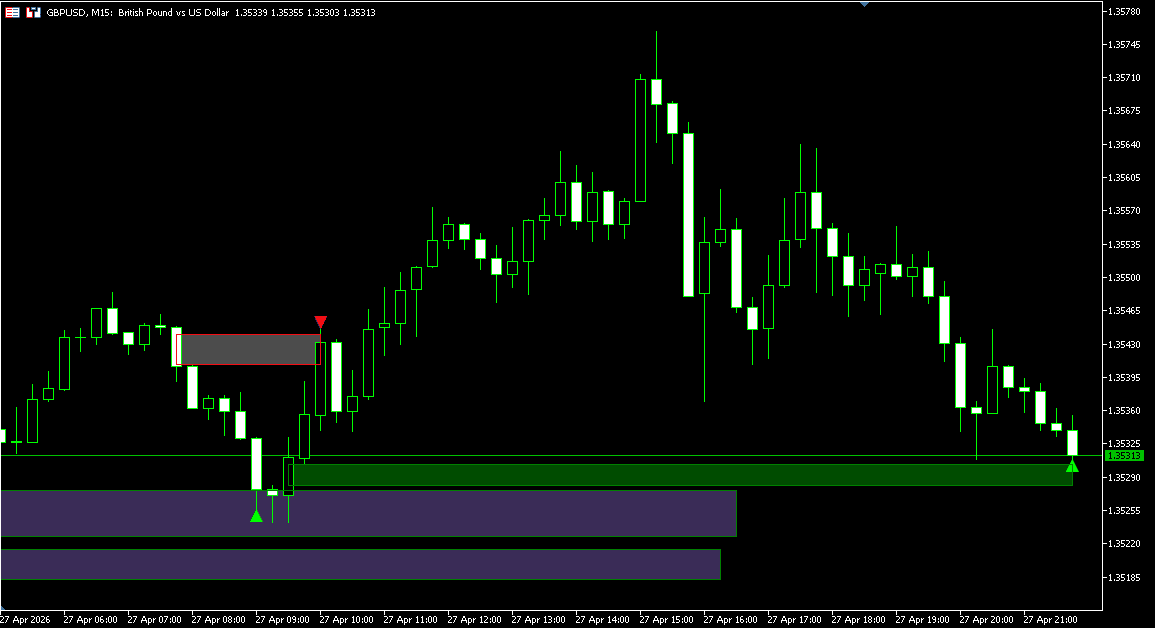
Not every Fair Value Gap remains relevant indefinitely. This indicator tracks the full lifecycle of each zone after creation.
New gaps begin as Active zones. If price later satisfies the selected mitigation condition, the zone changes to Mitigated status. If the gap remains unfilled beyond the selected lifetime, it becomes Expired.
Zone duration can be measured in bars or minutes, allowing the logic to adapt to different chart timeframes and trading styles.
A maximum display limit can also be applied to control how many zones remain visible at once.
Older zones remain available for review, while display limits prevent the chart from becoming cluttered.
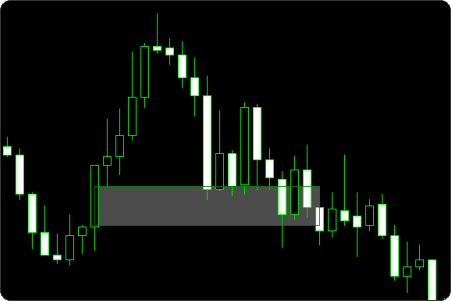
How a Fair Value Gap is considered filled can significantly change chart interpretation. This indicator includes multiple mitigation models so zone behavior can match different analytical approaches.
Full Mitigation requires the gap to be completely filled before the zone changes state.
Partial Mitigation recognizes the first qualifying touch into the imbalance area, allowing faster status updates when early interaction is enough.
Threshold Mitigation requires price to fill a user-defined percentage of the zone depth before mitigation is confirmed.
Threshold values can be adjusted to require shallow interaction or deeper rebalancing depending on preference.
Mitigation can also be validated using High / Low extremes or Close prices.
Close mode is stricter. High / Low mode reacts faster.
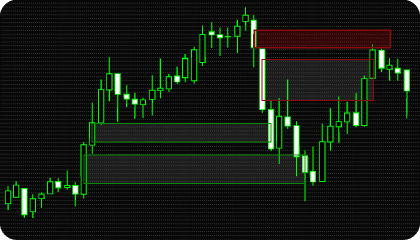
Fair Value Gaps are displayed directly on the chart using customizable bullish and bearish zone colors with adjustable opacity.
When a zone becomes mitigated or expired, its visual state can automatically change to separate active opportunities from historical context. Mitigated zones can remain visible in one color, while expired zones can be preserved in another.
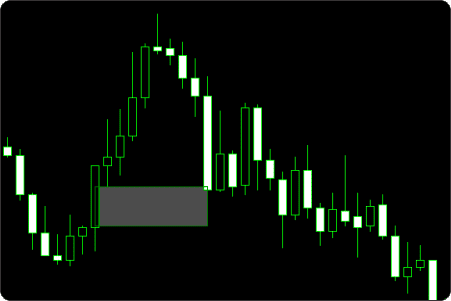
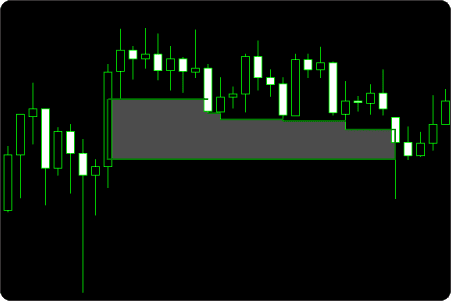
The indicator also includes Shrink Mode, where the zone contracts visually as price partially fills the imbalance.
This makes ongoing mitigation easier to read at a glance.
Display filters can also show only active zones, only inactive zones, only mitigated zones, or only expired zones depending on chart workflow.
The indicator includes a flexible notification system for key Fair Value Gap events.
Available alerts include:
Bullish and bearish touch signals are generated when price re-enters an active zone before mitigation has occurred.
Optional chart markers can identify detection, mitigation, and expiration events, while labels can be added directly to zones for faster recognition.
Run it quietly, or use it as an active FVG monitoring tool.
Newly detected zones begin as Active Fair Value Gaps. These represent imbalances that have not yet met the selected mitigation condition.
Bullish zones are typically watched when price trades above the gap and later retraces downward into the area. Bearish zones are commonly monitored when price trades below the gap and later rallies back into the zone.
Many traders focus first on active zones because they still represent unresolved price imbalance.
When price satisfies the selected mitigation method, the zone changes to Mitigated status and can remain visible as historical context.
If price never fills the zone within the selected lifetime, it becomes Expired. This helps separate older untouched gaps from currently relevant zones.
Keeping mitigated and expired zones on the chart can help review how price interacted with previous imbalance areas over time.
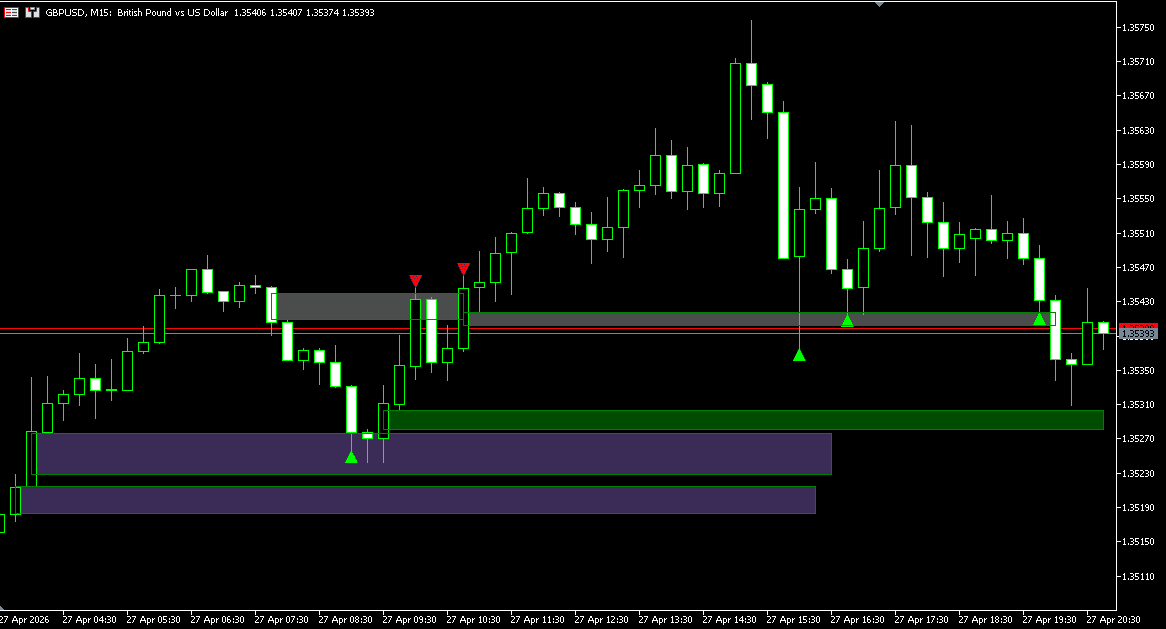
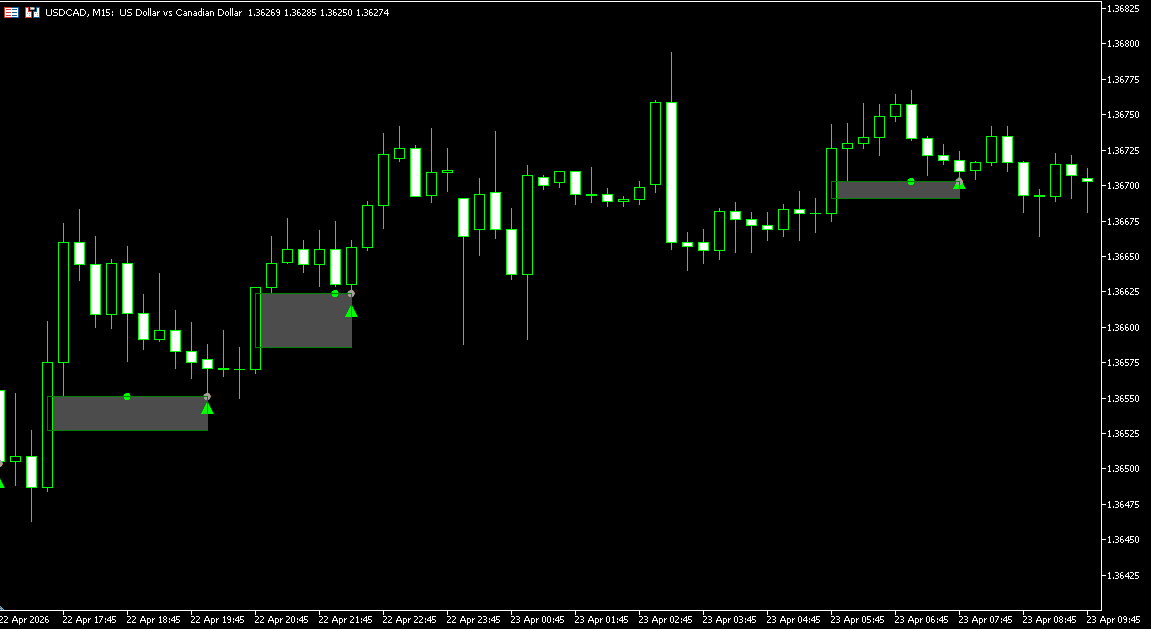
A touch event occurs when price re-enters an active Fair Value Gap before mitigation has occurred.
For bullish zones, this typically means price moved higher after creation and later retraced back into the gap. For bearish zones, price moved lower first and later rallied into the zone.
Some traders monitor these return-to-zone events because they represent renewed interaction with an unresolved imbalance.

Need changes to this indicator? We can customize it to your specifications — adding new functions, modifying logic, refining visuals, or integrating it with other trading tools.
We also convert indicators into Expert Advisors with advanced features such as trailing stops, position parameter controls, execution filters, and rule-based automation built to your technical specifications.
Request a free consultation to discuss the technical scope, timeline, and available development options.
We are committed to the ongoing development and refinement of our indicators. If you’ve spotted a bug, feel that something essential is missing, or have ideas that could make the indicator even better, just send us a message. Your feedback helps us improve and deliver tools that truly meet traders’ needs.
A Fair Value Gap (FVG) is a price imbalance created when the market moves aggressively enough to leave an area with limited two-sided trading. The concept is widely used in ICT and Smart Money Concepts (SMC) methodologies.
No. Once a Fair Value Gap is detected, the zone is plotted based on completed candle data and is not moved retroactively to create false historical signals.
Zone status may later update to mitigated or expired as new price data develops, but the original imbalance location does not repaint.
FVG Touched Signals are also fixed — once confirmed, they remain on the chart and are not removed or repositioned as new bars develop.
This indicator combines Fair Value Gap detection with advanced zone management tools that many basic FVG indicators do not include.
Key differences include:
It is designed as a full FVG workflow tool rather than a simple box-drawing indicator.
This helps separate current opportunities from historical context.
Shrink Mode reduces the visible size of a zone as price partially fills the imbalance.
This makes ongoing mitigation easier to track visually in real time.
Different methods suit different analytical styles.
Yes. The indicator can generate alerts when price re-enters an active zone, when a new zone is created, or when mitigation occurs.
Popup, sound, and email notifications are supported.
Yes. Direction filters allow displaying:
This is useful when aligning with broader directional bias.
Yes. Historical zones can remain displayed using separate visual states for mitigated and expired gaps.
This helps review prior price reactions and market structure context.
The indicator can be used on any MetaTrader 5 market with chart data, including:
Fair Value Gap analysis is most relevant where price movement creates clear displacement and retracement behavior.
Nordman Algorithms is a trade name of Nordman Algorithms OÜ (Reg. No. 14435535), registered in Tallinn, Estonia.
Software Nature & User Responsibility — Nordman Algorithms provides algorithmic software tools for technical analysis. Nordman Algorithms is not a financial advisor and is not liable for any losses. All trades conducted based on the software’s output are executed at the user’s sole discretion and risk.
Visual Markers & Signal Disclosure — This software may display visual markers (such as arrows, dots, or alerts) when predefined mathematical conditions are met. These markers are provided for educational and analytical purposes only, must not be interpreted as financial guidance, and do not constitute a recommendation to buy, sell, or hold any financial instrument. Users must independently validate all visual cues within their own trading methodology.
No Financial Advice — Nordman Algorithms does not provide discretionary trading signals, investment advice, or managed signal services. Our software represents a mathematical visualization of historical and real-time data. The appearance of a visual marker does not guarantee a profitable trade or predict future market behavior.
Trading Risk Warning — Futures, Forex, and options trading involve significant risk. Risk capital is money that can be lost without jeopardizing financial security. Only risk capital should be used for trading. Past performance is not indicative of future results. View Full Risk Disclosure: https://www.nordman-algorithms.com/risk-disclosure/
ESMA Risk Warning — Financial instruments, especially those involving leverage such as CFDs and Forex, are complex and carry a high risk of rapid financial loss. Our software provides analytical outputs and visual markers based on predefined mathematical conditions and does not mitigate or reduce inherent market risks. You should carefully consider whether you understand how leveraged financial instruments work and whether you can afford the high risk of losing your capital.
CFTC Rule 4.41 — Hypothetical or simulated performance results have inherent limitations. Unlike actual performance records, simulated results do not represent real trading. Because trades have not actually been executed, these results may under- or over-compensate for the impact of market factors such as liquidity. No representation is being made that any account will achieve profits or losses similar to those shown.